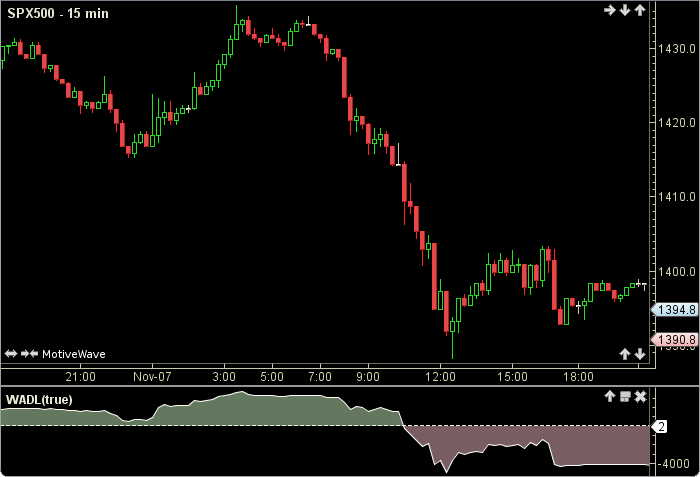
Williams AD Line
The Williams AD Line (WADL) was authored by Larry Williams. The WADL is the sum, of the positive (accumulated) or the negative (distributed) price movements, multiplied by the current volume, plus some feedback. Some versions of this indicator do not use volume in the calculations. The user may change the use volume switch. This indicator’s definition is further expressed in the condensed code given in the calculation below.
How To Trade Using Williams AD Line
This study may be used in conjunction with other indicators. No signals are calculated.
How To Access in MotiveWave
Go to the top menu, choose Add Study, start typing in this study name until you see it appear in the list, click on the study name, click OK.
Important Disclaimer: The information provided on this page is strictly for informational purposes and is not to be construed as advice or solicitation to buy or sell any security. Please see our Risk Disclosure and Performance Disclaimer Statement.
Calculation
//useVol = default is true
//index = current bar number
prevClose = close[index-1];
trHigh = max(high, prevClose);
trLow = min(low,  prevClose);
priceMove = 0.0;
if (close moreThan prevClose)
      priceMove = close - trLow;
endIf
if (close lessThan prevClose)
      priceMove = close - trHigh;
endIf
if (close == prevClose)
      priceMove = 0.0;
endIf
prevWadl = WADL[index-1];
wadl = 0.0;
wadl = priceMove + prevWadl;
if (useVol)
    wadl = (priceMove * vol) + prevWadl;
endIf
Plot wadl;