Volume Rate Of Change
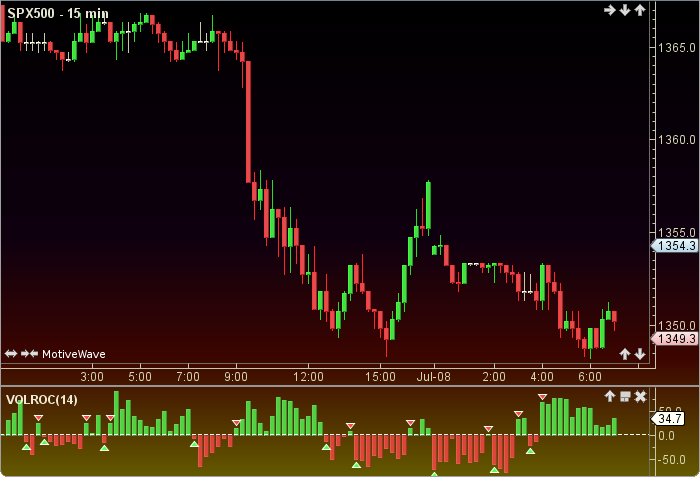
Volume Rate Of Change (VROC) was authored by Omega Reasearch 1997. The VROC uses the current volume and a prior volume to create an oscillator which is plotted as a histogram. The user may change the input (close) and period length. This indicator’s definition is further expressed in the condensed code given in the calculation below.
How To Trade Using Volume Rate Of Change
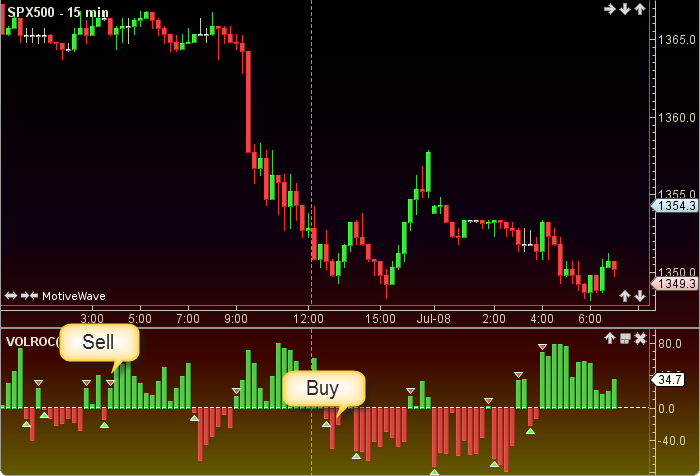
If the volRoc crosses above the 0 line the a sell signal will be generated. Conversely, if the volRoc crosses below the 0 line a buy signal will be given.
How To Access in MotiveWave
Go to the top menu, choose Study>Volume Based>Volume Rate Of Change
or go to the top menu, choose Add Study, start typing in this study name until you see it appear in the list, click on the study name, click OK.
Important Disclaimer: The information provided on this page is strictly for informational purposes and is not to be construed as advice or solicitation to buy or sell any security. Please see our Risk Disclosure and Performance Disclaimer Statement.
Calculation
//input = price, user defined, default is closing price, used in signal message only
//period = user defined, default is 14
//index = current bar number
v = getVolume(index);
if (v == null) v = 0;
priorV = volume(index-period);
if (priorV == null) priorV = 0;
volRoc = 0;
if ((priorV != 0) AND (v != 0)) volRoc = 100 * (v - priorV) /(v + priorV);
Plot: volRoc;
//Signals
lastVr = volRoc[index-1];
sell = (volRoc moreThan 0) AND (lastVr lessThan; 0);
buy = (volRoc lessThan 0) AND (lastVr moreThan 0);