Turbo Stochastic Slow
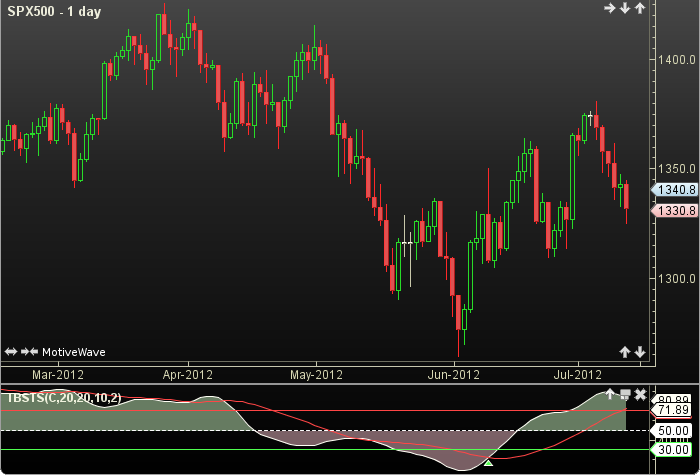
Turbo Stochastic Slow (TSS) was authored Omega Research 1996. The TSS first calculates the slow K and then smooths it twice with a Simple Moving Average to produce the slow D. The slow K and D lines are further manipulated with the Linear Regression line calculation which is effectively another smoothing technique. The Linear Regression point (bar number) may be chosen by the user defined turbo value. A plus value points to a future bar location, a minus to a past bar location. Adjustable guides are given to fine tune the trading signals. The user may change the input (close), period lengths, turbo and guide values. This indicator’s definition is further expressed in the condensed code given in the calculation below.
See also Turbo Stochastics Fast.
How To Trade Using Turbo Stochastic Slow
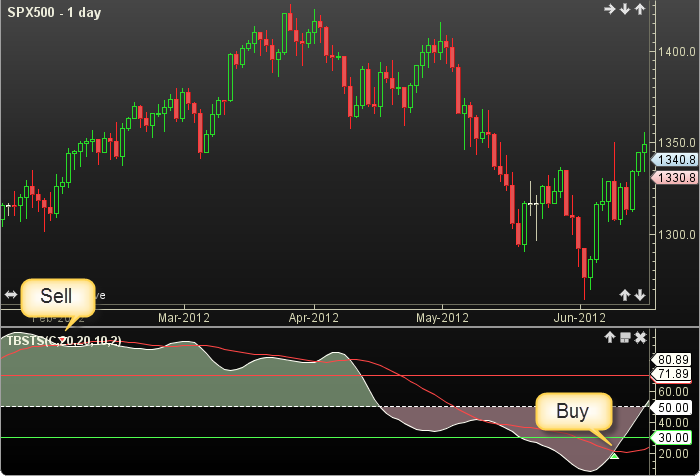
Adjust the top and bottom guides to control the quantity and quality of the trading signals. TSSK values above 70 are considered to be overbought and therefore offer an opportunity to sell. TSSK values below 30 are considered oversold and present an opportunity to buy. If the TSSK is above the top guide and crosses below the TSSD a sell signal will be generated. Conversely, if the TSSK is below the bottom guide and crosses above the TSSD a buy signal will be given. The 50 line divides the bulls above from the bears below.
How To Access in MotiveWave
Go to the top menu, choose Study>Oscillators>>Turbo Stochastics Slow
or go to the top menu, choose Add Study, start typing in this study name until you see it appear in the list, click on the study name, click OK.
Important Disclaimer: The information provided on this page is strictly for informational purposes and is not to be construed as advice or solicitation to buy or sell any security. Please see our Risk Disclosure and Performance Disclaimer Statement.
Calculation
//input = price, user defined, default is closing price
//kPeriod = user defined, default is 20
//dPeriod = user defined, default is 20
//regress = linear regression period = user defined, default is 10
//turbo = user defined, default is +2
//stochK = stochastics slow K, sma = simple moving average
//index = current bar number
fastK = stochK(index, kPeriod, input);
slowK = sma(index, kPeriod, fastK);  //same as fastD
slowD = sma(index, dPeriod, slowK);
if (turbo lessThan 0) turbo = Math.max(turbo, -regress);
if (turbo moreThan 0) turbo = Math.min(turbo, regress);
Plot1: tssK = linRegLine(index, regress, slowK, regress + turbo)[0];
Plot2: tssD = linRegLine(index, regress, slowD, regress + turbo)[0];
//Signals
highSell = tssK for last sell signal, reset to max_negative at each  buy signal;
lowBuy = tssK for last buy signal, reset to max_positive at each sell signal;
sell = crossedBelow(TSSK, TSSD) AND tssK moreThan topGuide AND (tssK moreThan highSell);
buy = crossedAbove(TSSK, TSSD) AND tssK lessThan bottGuide AND (tssK lessThan lowBuy);