Tilson IE/2
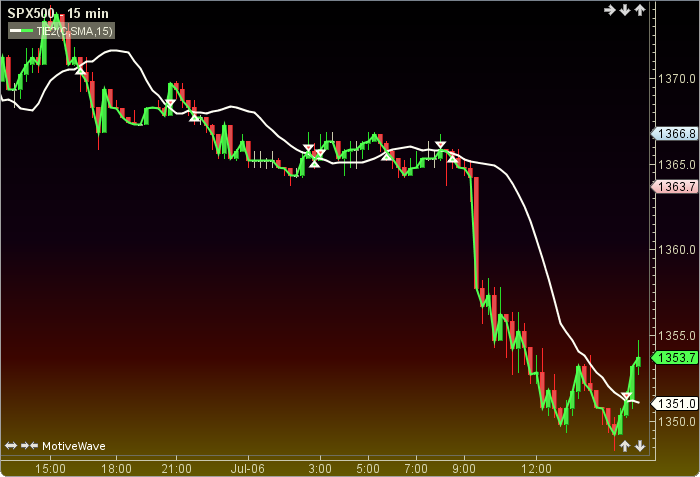
Tilson IE/2, by Tim Tilson, is a type of moving average; it uses the linear regression slope (m) in the line equation (y=a+mx). When the average crosses the input price trading signals are given. The user may change the input (close), method (SMA) and period length. This indicator’s definition is further expressed in the condensed code given in the calculation below.
How To Trade Using Tilson IE/2
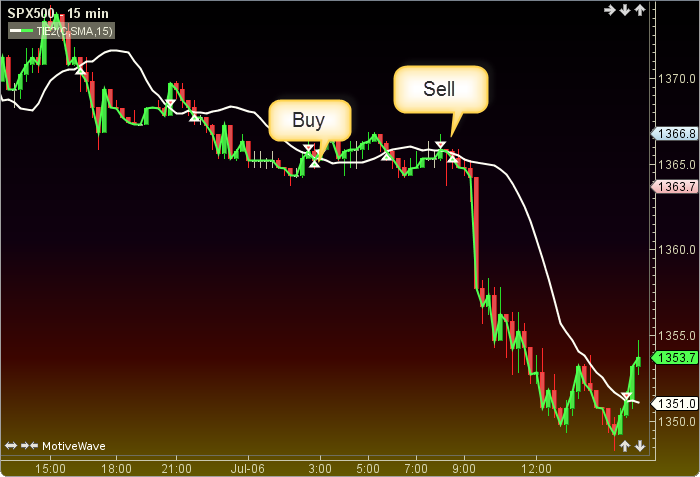
Trading signals are triggered when the IE2 and the price cross. If the IE2 crosses above (upward movement) a buy signal is generated. Conversely, if the IE2 crosses below (downward movement) a sell signal is given.
How To Access in MotiveWave
Go to the top menu, choose Study>Overlays>Tilson IE/2
or go to the top menu, choose Add Study, start typing in this study name until you see it appear in the list, click on the study name, click OK.
Important Disclaimer: The information provided on this page is strictly for informational purposes and is not to be construed as advice or solicitation to buy or sell any security. Please see our Risk Disclosure and Performance Disclaimer Statement.
Calculation
//input = price, user defined, default is close
//method = moving average, user defined, default is SMA
//period = user defined, default is 15
//av = average
//ma = moving average, index = current bar number
//a and m are values in line equation y=a+mx.
avPrice = ma(method, index, period, input);
value[] = linRegLine(index, period, input, 0);
a = value[0];.
m = value[1] + avPrice;
Plot1: ie2 = (m + a) / 2;
Plot2: price;
//Signals
buy = crossedAbove(IE2, price);
sell = crossedBelow(IE2, price);