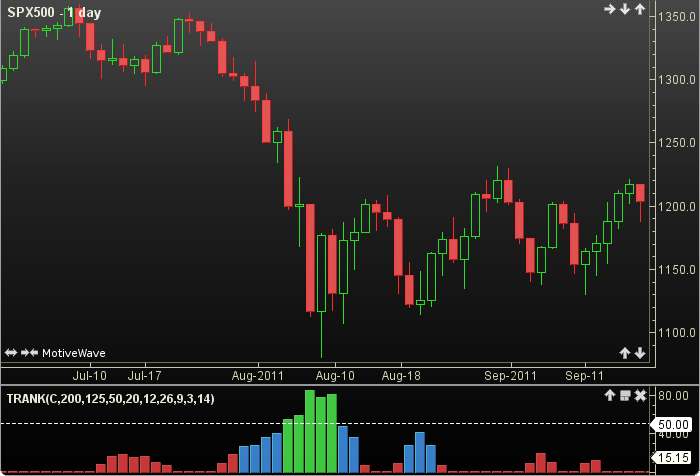
Technical Rank
Technical Rank (TR) was authored by John Murphy. The instrument’s price is plied with multiple moving averages, rate of change and the relative strength index. These values are mathematically manipulated with percentage factors and then summed together. The total is rounded and truncated, forcing it to conform to the technical rank range of 0 to 100, and finally, it is put on display as a tri-colored histogram. The user may change the input (close) and multiple period lengths. This indicator’s definition is further expressed in the condensed code given in the calculation below.
How To Trade Using Technical Rank
Technical Rank may be useful in choosing a stock. No trading signals are calculated for this indicator.
How To Access in MotiveWave
Go to the top menu, choose Study>Performance>Technical Rank
or go to the top menu, choose Add Study, start typing in this study name until you see it appear in the list, click on the study name, click OK.
Important Disclaimer: The information provided on this page is strictly for informational purposes and is not to be construed as advice or solicitation to buy or sell any security. Please see our Risk Disclosure and Performance Disclaimer Statement.
Calculation
//input = price, user defined, default is closing price
//method = moving average (ma), user defined, default is EMA
//p1 = period, user defined, default is 200
//p2 = period, user defined, default is 125
//p3 = period, user defined, default is 50
//p4 = period, user defined, default is 20
//p5 = period, user defined, default is 12
//p6 = period, user defined, default is 26
//p7 = period, user defined, default is 9
//p8 = period, user defined, default is 3
//p9 = period, user defined, default is 14
//sma = simple moving average, ema = exponential moving average
//roc = rate of change, rsi = relative strength index
//index = current bar number
ma1 = sma(index, p1, input);
ltMa =  .3 * 100 * (price - ma1) / ma1;
ltRoc = .3 * 100 * roc(index, p2, key);
ma2 = sma(index, p3, key);
mtMa = .15 * 100 * (price - ma2) / ma2;
mtRoc = .15 * 100 * roc(index, p4, input);
ma5 = ema(index, p5, input);
ma6 = ema(index, p6, key);
ppo = 100 * (ma5 - ma6) / ma6;
sig = ema(index, p7, key);
ppoHist = ppo - sig;
value = ppoHist[index];
priorV = ppoHist[index-p8];
slope = (value - priorV) / p8; //rise over run = slope of ppoHist
stPpo = .05 * 100 * slope;
rsi = rsi(index, p9, input)[0];
stRsi = .05 * rsi;
tr = ltMa + ltRoc + mtMa + mtRoc + stPpo + stRsi;
if (tr lessThan 0) tr = 0;
if (tr moreThan 100) tr = 100;
PlotHist: tr;;