Stochastic SC
This Stochastics SC or Stochastic Custom calculation uses close, highest highs and lowest lows. The numerator (price- lowest) and denominator (highest – lowest) are separately smoothed before being turned into an oscillator referred to as the Stochastic Custom K (SCK). The SCK is then smoothed to produce the Stochastic Custom D (SCD) which is used as a signal line. Adjustable guides are given to fine tune the trading signals. The user may change the input (close), period lengths, and signal method. This indicator’s definition is further expressed in the condensed code given in the calculation below.
See also Stochastic Oscillator.
How To Trade Using Stochastics SC
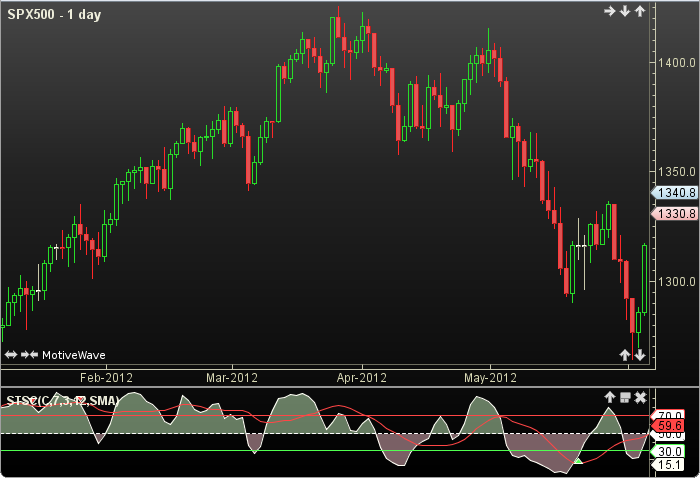
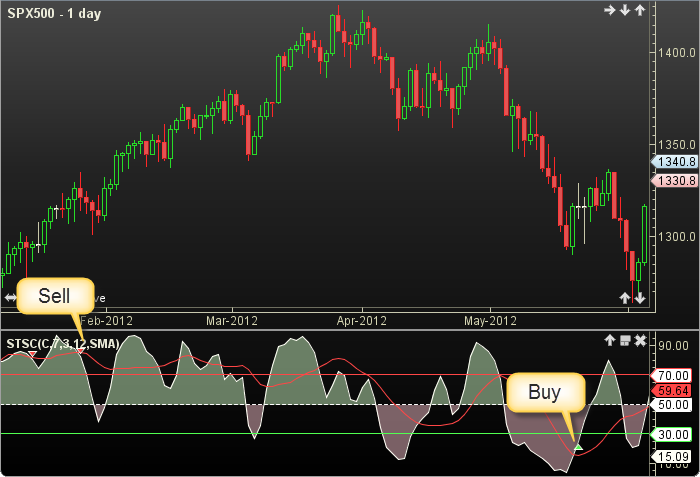
Adjust the top and bottom guides to control the quantity and quality of the trading signals. SCK values above 70 are considered to be overbought and therefore offer an opportunity to sell. SCK values below 30 are considered oversold and present an opportunity to buy. If the SCK is above the top guide and crosses below the SCD a sell signal will be generated. Conversely, if the SCK is below the bottom guide and crosses above the SCD a buy signal will be given. The 50 line divides the bulls above from the bears below.
How To Access in MotiveWave
Go to the top menu, choose Study>Oscillators>>Stochastics SC
or go to the top menu, choose Add Study, start typing in this study name until you see it appear in the list, click on the study name, click OK.
Important Disclaimer: The information provided on this page is strictly for informational purposes and is not to be construed as advice or solicitation to buy or sell any security. Please see our Risk Disclosure and Performance Disclaimer Statement.
Calculation
//input = price, user defined, default is closing price
//fkPeriod = user defined, default is 7
//ckPeriod = user defined, default is 3
//cdPeriod = user defined, default is 12
//method = moving average (ma), user defined, default is SMA
//diff = difference, num = numerator, den = denomator
//av = average, sma = simple moving average
highest = highest(fkPeriod, HIGH);
lowest = lowest(fkPeriod, LOW);
diff = highest - lowest;
num = price - lowest;
den = diff;
avNum = sma(ckPeriod, NUM);
avDen = sma(ckPeriod, DEN);
if (diff moreThan 0)
    if (ckPeriod lessOr= 1) sck = num / den * 100;
    else sck = avNum / avDen * 100;
endIf
Plot1: sck;
Plot2: scd = ma(method, cdPeriod, SCK);
//Signals
highSell = sck for last sell signal, reset to max_negative at each  buy signal;
lowBuy = sck for last buy signal, reset to max_positive at each sell signal;
sell = crossedBelow(SCK, SCD)  AND sck moreThan topGuide AND (sck moreThan highSell);
buy = crossedAboveSCK, SCD) AND sck lessThan bottGuide AND (sck lessThan lowBuy);