Stochastic Momentum Index
The Stochastic Momentum Index provides a refinement of the Stochastic Oscillator. In comparison, the SMI shows where the close is relative to the midpoint of the same range. The SMI ranges between +100 and -100 and is somewhat less erratic than a Stochastic Oscillator over the same period. The user may change the method (EMA) and period lengths. This indicator’s definition is further expressed in the condensed code given in the calculation below.
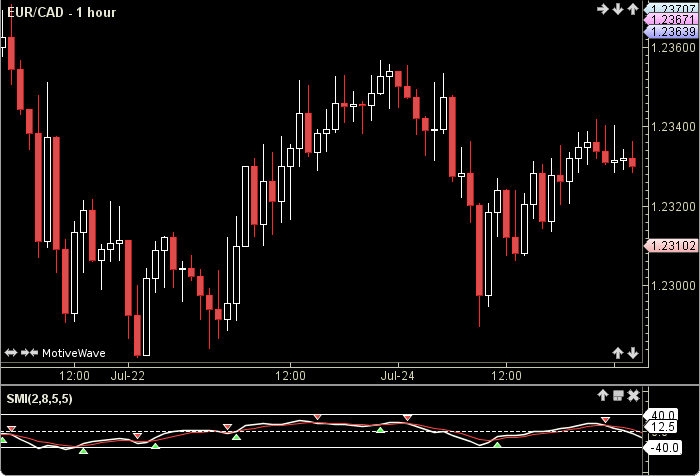
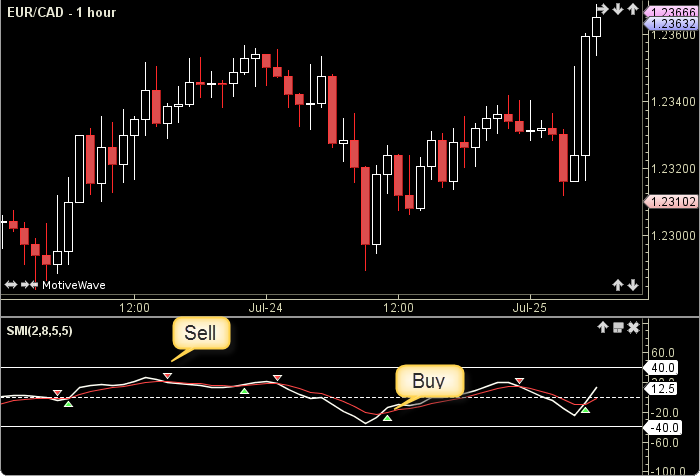
How To Trade Using the Stochastic Momentum Index
If the SMI crosses above the SIGNAL line a buy signal will be generated. Conversely, if the SMI crosses below the SIGNAL line a sell signal will be given.
How To Access in MotiveWave
Go to the top menu, choose Study>General>Stochastic Momentum Index
or go to the top menu, choose Add Study, start typing in this study name until you see it appear in the list, click on the study name, click OK.
Important Disclaimer: The information provided on this page is strictly for informational purposes and is not to be construed as advice or solicitation to buy or sell any security. Please see our Risk Disclosure and Performance Disclaimer Statement.
Calculation
//method = moving average (ma), user defined, default is EMA
//high low Period = hlPeriod = user defined, default is 2
//maPeriod = user defined, default is 8
//smoothPeriod = user defined, default is 5
//signalPeriod = user defined, default is 5
//index = current bar number
HH = highest(index, hlPeriod, HIGH);
LL = lowest(index, hlPeriod, LOW);
M = (HH + LL)/2;
D = getClose(index) - M;
HL = HH - LL;
D_MA = ma(method, index, maPeriod, D);
HL_MA = ma(method, index, maPeriod, HL);
D_SMOOTH = ma(method, index, smoothPeriod, D_MA);
HL_SMOOTH = ma(method, index, smoothPeriod, HL_MA);
HL2 = HL_SMOOTH/2;
SMI = 0;
SMI = 100 * (D_SMOOTH/HL2);
SIGNAL = ma(method, index, signalPeriod, SMI);
//Signals
buy = crossedAbove(SMI, SIGNAL);
sell = crossedBelow(SMI, SIGNAL);