Sentiment Zone Oscillator (SZO)
The Sentiment Zone Oscillator (SZO) was authored by Walid Khalil in the Stocks and Commodities Magazine, May 2012. The SZO uses a triple exponential moving average (TEMA) of a plus-minus value, triggered by the current and previous closing prices. Over-bought and over-sold paths and adjustable guides are also given. The user may change the input (close), method (TEMA), period lengths, percent factor and guide values. This indicator’s definition is further expressed in the condensed code given in the calculation below.
How To Trade Using Sentiment Zone Oscillator
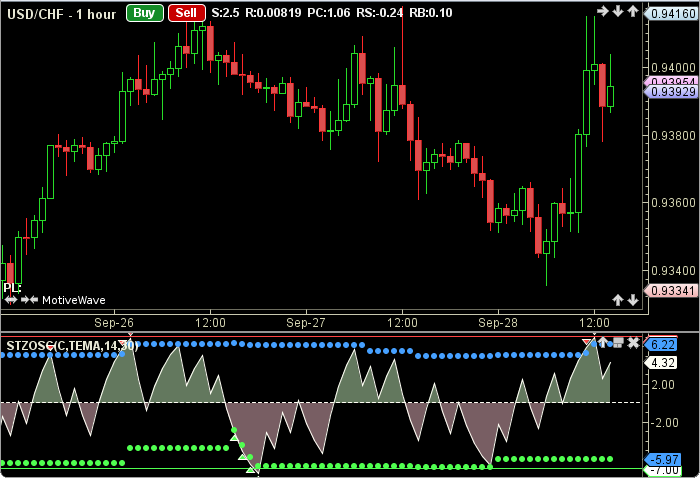
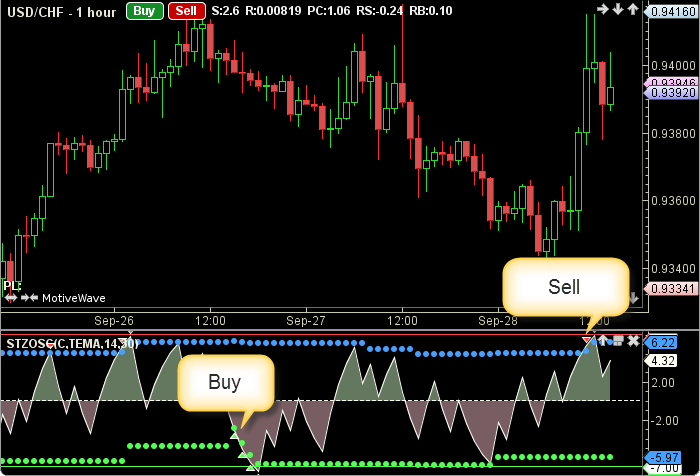
Adjust the top and bottom guides to control the quantity and quality of the trading signals. SZO values above 7 are considered to be overbought and therefore offer an opportunity to sell. SZO values below -7 are considered oversold and present an opportunity to buy. In addition to the guides, dynamic over-bought or over-sold paths are plotted. If the SZO is above the top guide or crosses above the over-bought path a sell signal will be generated. Conversely, if the SZO is below the bottom guide or crosses the over-sold path a buy signal will be given.
How To Access in MotiveWave
Go to the top menu, choose Study>Oscillators>Sentiment Zone Oscillator
or go to the top menu, choose Add Study, start typing in this study name until you see it appear in the list, click on the study name, click OK.
Important Disclaimer: The information provided on this page is strictly for informational purposes and is not to be construed as advice or solicitation to buy or sell any security. Please see our Risk Disclosure and Performance Disclaimer Statement.
Calculation
//input = price, user defined, default is closing price
//method = moving average, user defined, default is TEMA
//period = user defined, default is 14
//longPeriod = user defined, default is 30
//index = current bar number
factor = fac/100;
prevPrice = price[index-1];
if (price moreThan prevPrice) r = 1;
else r = -1;
sp = ma(method, index, period, R);
Plot1: szo = 100 * sp / period;
highest = highest(index, longPeriod, SZO);
lowest = lowest(index, longPeriod, SZO);
range = highest - lowest;
Plot2: ob = lowest + range * factor;
Plot3: os = highest - range * factor;
//Signals
sell = szo moreThan ob OR szo moreThan topGuide;
buy = szo lessThan os OR  szo lessThan bottG;