Projection Band UL
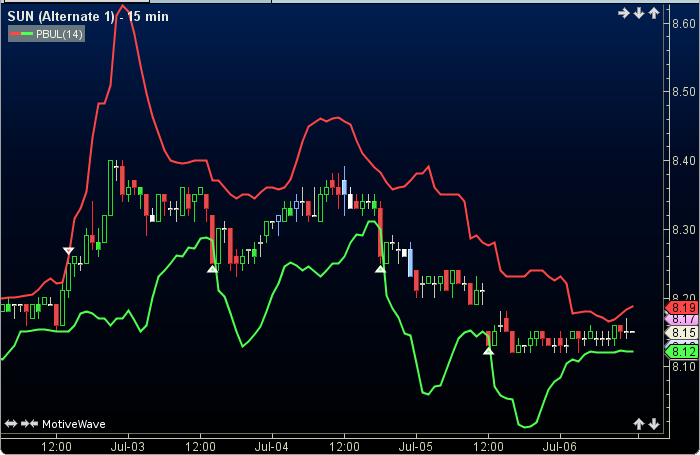
The Projection Band UL was authored by Mel Widner in the Stocks and Commodities Mag. 07/1995. It uses the linear regression slope (m) in the line equasion (y=a+mx). It displays 2 paths, one based on the high price(UB), the other on the low price(LB). The user may modify the period (14). This indicator’s definition is further expressed in the condensed code given in the calculation below.
How To Trade using Projection Band UL
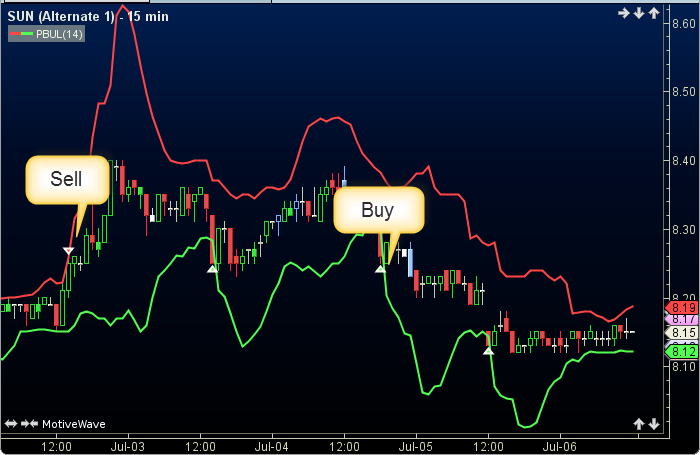
Adjust the bands to control the quantity and quality of the trading signals. If a high goes above the ub a sell signal is generated. Conversely, if a low goes below the lb a buy signal is given.
How To Access in MotiveWave
Go to the top menu, choose Study>Mel Widner>Projection Band UL
or go to the top menu, choose Add Study, start typing in this study name until you see it appear in the list, click on the study name, click OK.
Important Disclaimer: The information provided on this page is strictly for informational purposes and is not to be construed as advice or solicitation to buy or sell any security. Please see our Risk Disclosure and Performance Disclaimer Statement.
Calculation
//period = user defined, default is 14
//prev = previous
//index = current bar number
//m = slope in line equation, y = a + mx
//LOE = less or equal, MOE = more or equal
pu = 0, pl = MAX_VALUE;
mHigh = linRegLine(index, period, high, 0)[1];
mLow = linRegLine(index, period, low, 0)[1];
count = 0;
for (int i = (index-period+1); i LOE index; i++)  //move back 1 period
    prevHigh = high[i-1];
    prevLow = low[i-1];
    vHigh = prevHigh + (mHigh * (count));
    vLow = prevLow + (mLow * (count));
    if (vHigh moreThan pu) pu = vHigh;
    if (vLow lessThan pl) pl = vLow;
    count++;
end;
Plot1: pl;
Plot2: pu;
 //Signals
sell = high moreThan pu;
buy = low lessThan pl;