Price Channel
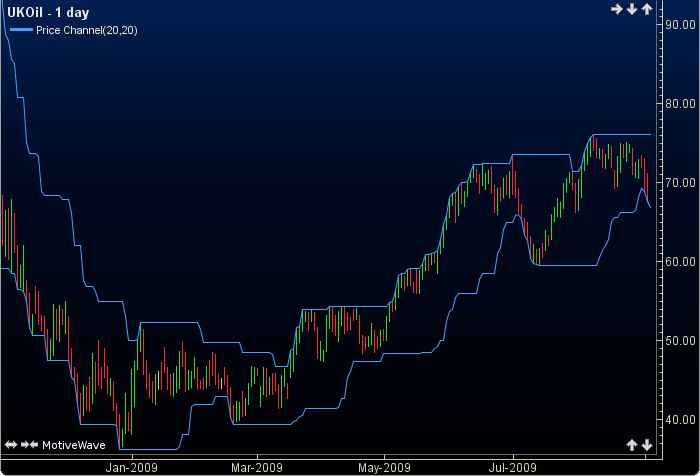
The Price Channel forms boundaries above and below the price line and can be used as indicators of volatility. The upper band indicates the highest price over the past top period, and the lower band indicates the lowest price over the past bottom period. The user may change either or both of the period lengths. This indicator’s definition is further expressed in the condensed code given in the calculation below.
How To Trade Using Percentage Trend
No trading signals are calculated for this indicator.
How To Access in MotiveWave
Go to the top menu, choose Study>Overlays>Price Channel
or go to the top menu, choose Add Study, start typing in this study name until you see it appear in the list, click on the study name, click OK.
Important Disclaimer: The information provided on this page is strictly for informational purposes and is not to be construed as advice or solicitation to buy or sell any security. Please see our Risk Disclosure and Performance Disclaimer Statement.
Calculation
//topPeriod = user defined, default is 20
//bottomPeriod = user defined, default is 20
Plot1: top = highest(index, topPeriod, HIGH);
Plot2: bottom = lowest(index, bottomPeriod, LOW);