Pivot Points
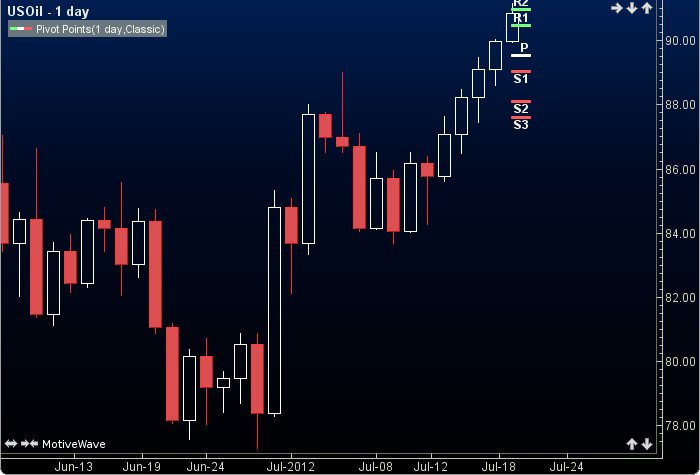
Pivot points are often used as a predictive indicator to identify support and resistance points based on the previous time frames values (usually the previous day’s high, low and closing prices). The user may change the type (Classic), show all points option and show labels option. This indicator’s definition is further expressed in the code given in the calculation below.
How To Trade Using Pivot Points
Pivot Points may identify support and resistance points and used in conjuction with other studys. No trading signals are given for this indicator.
How To Access in MotiveWave
Go to the top menu, choose Study>Overlays>Pivot Points
or go to the top menu, choose Add Study, start typing in this study name until you see it appear in the list, click on the study name, click OK.
Important Disclaimer: The information provided on this page is strictly for informational purposes and is not to be construed as advice or solicitation to buy or sell any security. Please see our Risk Disclosure and Performance Disclaimer Statement.
Calculation
//type = user selection, default is Classic
//types are Classic,Woodie,Camarilla,Fibonacci,Fib Zone,Fib Zone2
//show all points = user selection, default is false
//show labels = user selection, default is true
Code may be available on request.