Moving Average Convergence Divergence
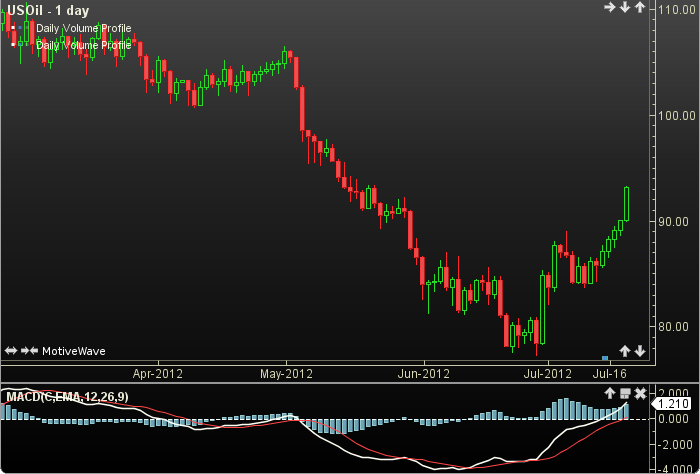
Moving Average Convergence Divergence (MACD) was authored by Gerald Appel in the 1960s and in 1986 Thomas Aspray added a histogram. The MACD shows the difference between a fast and a slow moving average. It is often used to indicate changes in market trends. The user may change the input (close), methods and period lengths. This indicator’s definition is further expressed in the condensed code given in the calculation below.
Click here for more information.
How To Trade Using the Moving Average Convergence Divergence (MACD)
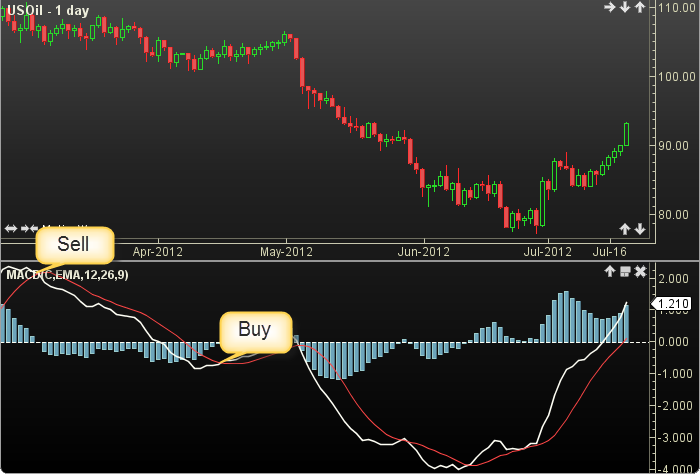
The MACD may be used as a trend changing indicator. If the MACD crosses above the SIGNAL line a buy signal will be generated. Conversely, if the MACD crosses below the SIGNAL line a sell signal will be given.
How To Access in MotiveWave
Go to the top menu, choose Study>General>Moving Average Conv/Div (MACD)
or go to the top menu, choose Add Study, start typing in this study name until you see it appear in the list, click on the study name, click OK.
Important Disclaimer: The information provided on this page is strictly for informational purposes and is not to be construed as advice or solicitation to buy or sell any security. Please see our Risk Disclosure and Performance Disclaimer Statement.
Calculation
//input = price, user defined, default is close
//method = moving average (ma) user defined, default is EMA
//signal method = moving average (ma) user defined, default is SMA
//period1 = user defined, default is 12
//period2 = user defined, default is 26
//signal period = user defined, default is 9
index = current bar number
MA1 = ma(method, index, period1, input);
MA2 = ma(method, index, period2, input);
Plot1: MACD = MA1 - MA2;
//Calculate moving average of MACD (signal line)
Plot2: signal = ma(signalMethod, index, signalPeriod, MACD);
PlotHist: MACD - signal;
//Check for signal events
buy = crossedAbove(MACD, SIGNAL)
sell = crossedBelow(MACD, SIGNAL)