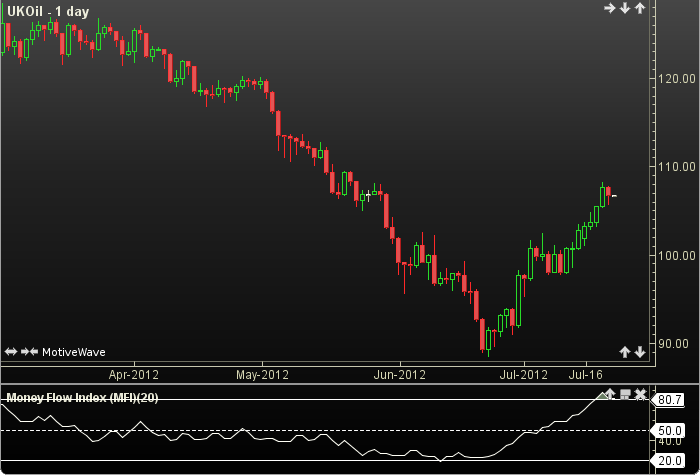
Money Flow Index
The Money Flow Index (MFI) is similar to the Relative Strength Index in how it is calculated and interpreted. MFI is considered to be more rigid since it is volume-weighted and illustrates the flow of money in and out of an instrument. The user may change only the period length. This indicator’s definition is further expressed in the condensed code given in the calculation below.
Click here for more information
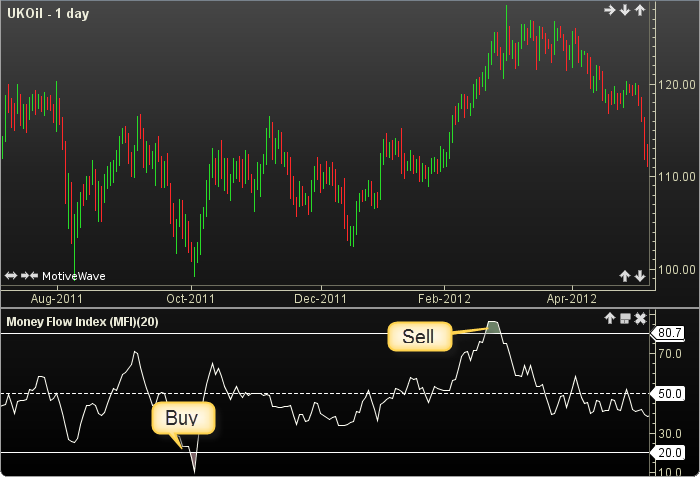
How To Trade Using Money Flow Index
Adjust the top and bottom guides to control the quantity and quality of the trading signals. If the MFI crosses above the top guide a sell signal will be generated, Conversely, if the MFI crosses below the bottom guide a buy signal will be given.
How To Access in MotiveWave
Go to the top menu, choose Study>General>Money Flow Index
or go to the top menu, choose Add Study, start typing in this study name until you see it appear in the list, click on the study name, click OK.
Important Disclaimer: The information provided on this page is strictly for informational purposes and is not to be construed as advice or solicitation to buy or sell any security. Please see our Risk Disclosure and Performance Disclaimer Statement.
Calculation
//period = user defined, default is 20
//LT = less than, LOR= = less or equal
//index = current bar number
PMF = 0; // positive money flow
NMF = 0; // negative money flow
pTP = getTypicalPrice(index-period);
for(i = index-period+1; i LOR= index; i++)
    double TP = getTypicalPrice(i);
    double MF = TP * getVolume(i); // money flow
    if (TP MT pTP) PMF += MF;
    else NMF += MF;
    pTP = TP;
endFor
Plot: MFI = 100 * ( PMF / (PMF + NMF) );
// Signals
buy =  crossedAbove(MFI, topGuide);
sell = crossedBelow(MFI, bottGuide);