Mass Index
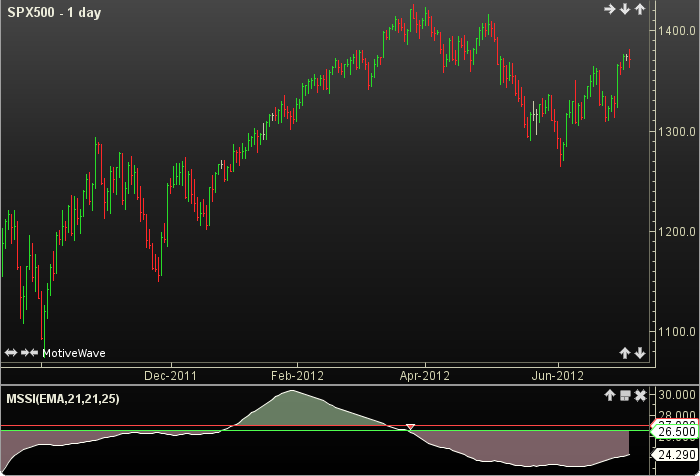
Mass Index by Donald Dorsey uses highs, lows and exponential moving averages to indicate upcoming price reversals. The key event is called a reversal bulge, which occurs when the Mass Index rises above the 27 line and then falls below 26.5. A trend indicator, which is an EMA of the close, is used to determine whether the signal is buy or sell. The user may change the input (close), methods(EMAs), period lengths and guide values. This indicator’s definition is further expressed in the condensed code given in the calculation below.
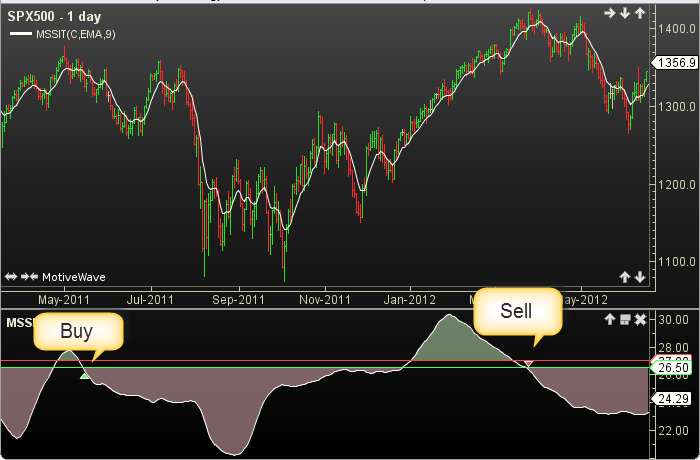
How To Trade Using Mass Index
Mass Index is used with Mass Index Trend to determine a buy or sell signal. The first condition (C1) for either signal is dependant on the previous path of Mass Index. It must have crossed above the top guide set at 27 and then have fallen through the bottom guide set at 26.5. A sell signal is given when C1 AND an up trend. Conversely, a buy signal is generated when C1 AND a down trend.
How To Access in MotiveWave
Go to the top menu, choose Study>Oscillators>Mass Index
or go to the top menu, choose Add Study, start typing in this study name until you see it appear in the list, click on the study name, click OK.
Important Disclaimer: The information provided on this page is strictly for informational purposes and is not to be construed as advice or solicitation to buy or sell any security. Please see our Risk Disclosure and Performance Disclaimer Statement.
Calculation
//key = price (user defined, default is closing price)
//method = moving average (user defined, default is EMA)
//period1 = user defined, default is 21
//period2 = user defined, default is 21
//period3 = user defined, default is 25
//trendPeriod = user defined, default is 9
//trendMethod = moving average (user defined, default is EMA)
//LT = less than, index = current bar number
//MT = more than
Plot1: TREND = ma(trendMethod, index, trendPeriod, key);
HL = high - low;
firstEma = ma(method, index, period1, HL);
secondEma = ma(method, index, period2, firstEma);
RATIO = secondEma / firstEma;
ALERT = false;
Plot2: massIndex = sum(index, period3, RATIO);
//Signals
lastTrend = TREND[index-1];
prevAlert = ALERT[index-1];
upTrend = lastTrend LT  TREND;
downTernd = lastTrend MT TREND
if (massIndex MT topGuide) ALERT = true);
if (massIndex MT bottGuide AND prevAlert) ALERT = true);
sell = massIndex LT bottomGuide AND prevAlert AND upTrend;
buy = massIndex LT bottomGuide AND prevAlert AND downTrend;