Linear Regression Curve
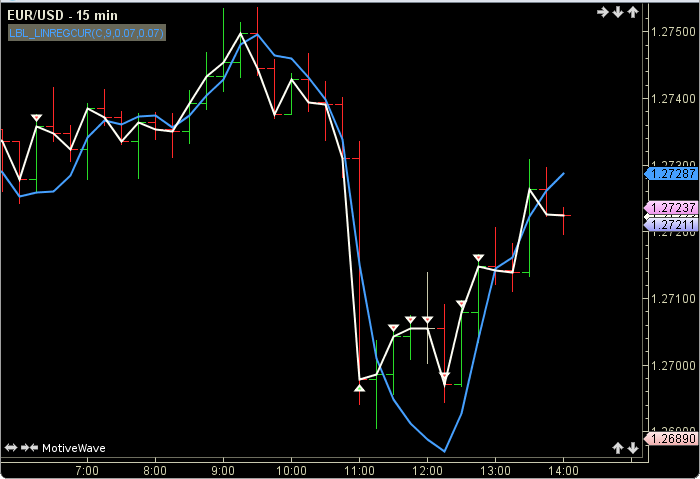
Linear Regression Curve (LRC) is a type of Moving Average based on the linear regression line equation (y = a + mx). The calculation produces a straight line with the best fit for the various prices for the period. The end point of this line is used to plot the LRC. A signal line (PRICE), which is price chosen by the user is used to help trigger signals. Two user factors are applied to the price to determine the buy or sell signal. The user may change the input (close), period length and factors. This indicator’s definition is further expressed in the condensed code given in the calculation below.
Click here for more information on Linear Regression
How To Trade Using Linear Regression Curve
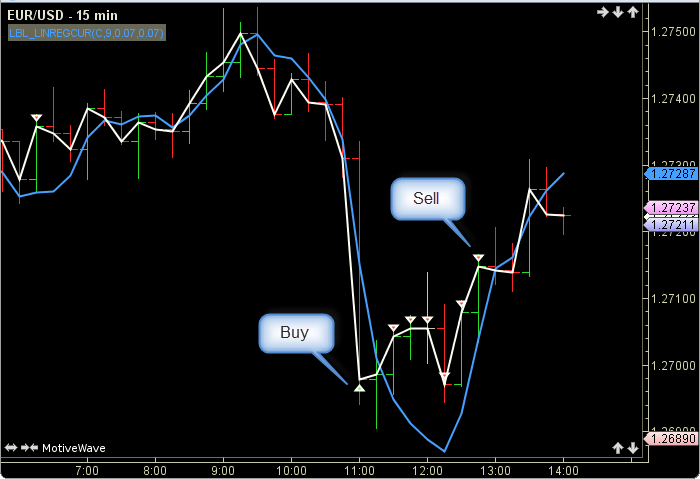
A buy signal is generated when the price moves below the linear regression curve times a user defined percent value. Conversely, a sell signal is given when the price moves above the linear regression curve times a user defined percent value.
How To Access in MotiveWave
Go to the top menu, choose Add Study, start typing in this study name until you see it appear in the list, click on the study name, click OK.
Important Disclaimer: The information provided on this page is strictly for informational purposes and is not to be construed as advice or solicitation to buy or sell any security. Please see our Risk Disclosure and Performance Disclaimer Statement.
Calculation
//input = price, default is closing price
//period = linear regression period, default is 9
//pcAbove = percent above, default is .009
//pcBelow = percent below, default is .009
//index = current bar number
price = getPrice(index, input, 0);
linReg = linRegLine(index, period, input, period)[0]; //end point of lin. reg. line
plot1: linReg;
plot2: price;
//Signals
pcAbove = 1 + pcAbove/100.0;
pcBelow = 1 - pcBelow/100.0;
sell = price moreThan; linReg * pcAbove;
buy = price lessThan; linReg * pcBelow;