Linear Regression
Linear Regression is a statistical representation of the price data. It is a straight line on an x (date) y (price) graph that best represents the price data between its starting and ending points. It is calculated using the sum of least squares method. The user may change the input (close), number of regression bars and number of future bars. This indicator’s definition is further expressed in the condensed code given in the calculation below.
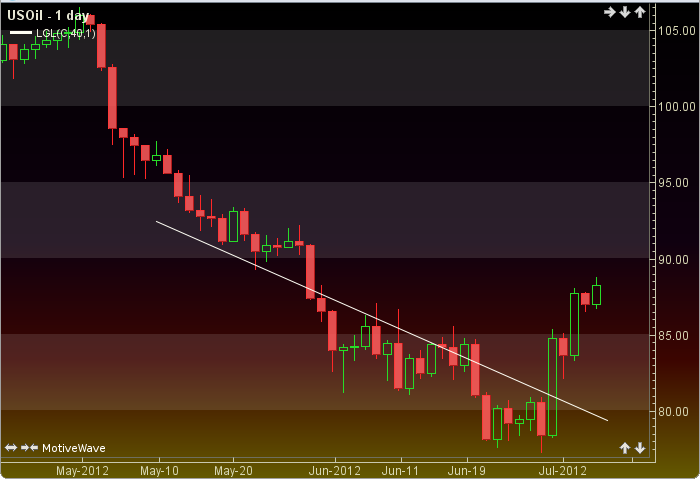
How To Trade Using Linear Regression
The linear regression line may be used to show the current trend. The slope of the line designates an upward or downward trend. No signals are generated and it should be used in conjunction with other indicators.
How To Access in MotiveWave
Go to the top menu, choose Add Study, start typing in Linear Regression until you see it appear in the list, click on the study name, click OK.
Important Disclaimer: The information provided on this page is strictly for informational purposes and is not to be construed as advice or solicitation to buy or sell any security. Please see our Risk Disclosure and Performance Disclaimer Statement.
Calculation
//input = price, user defined, default is closing price
//noBars = user defined, default is 40
//noFutureBars = user defined, default is 1
//index = current bar number
endIndex = size() -1;
startIndex = endIndex - noBars;
value[] = linRegLine(endIndex, noBars, input);
a = value[0];   //a in line equasion y = a + (m * x)
m = value[1];  //m in line equasion y = a + (m * x)
//y = a + (m * x)
startY = a + (m * 0);
endY = a + (m * noBars);
start = Coordinate(getStartTime(startIndex), startY);
end = Coordinate(getStartTime(endIndex), endY);
line = Line(start, end);
line.setExtendRight(noFutureBars);
addFigure(line);