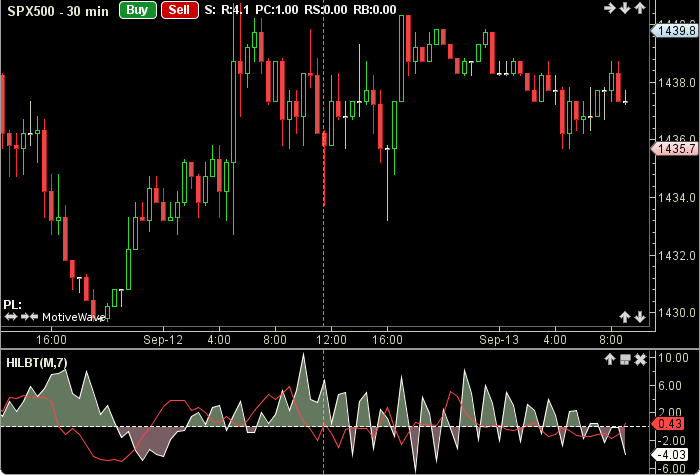
Hilbert Transform Indicator
The Hilbert Transform Indicator was authored by John Ehlers. The Hilbert Transform itself, is an all-pass filter used in digital signal processing. By using present and prior price differences, and some feedback, price values are split into their complex number components of real (inPhase) and imaginary (quadrature) parts. The user may change the input (midpoint), and period length. This indicator’s definition is further expressed in the condensed code given in the calculation below.
Click here for more information
How To Trade Using the Hilbert Transform Indicator
The Hilbert Transform Indicator may be used in conjuction with other indicators. No trading signals are calculated in this study.
How To Access in MotiveWave
Go to the top menu, choose Study>John Ehlers>Hilbert Transform Indicator
or go to the top menu, choose Add Study, start typing in this study name until you see it appear in the list, click on the study name, click OK.
Important Disclaimer: The information provided on this page is strictly for informational purposes and is not to be construed as advice or solicitation to buy or sell any security. Please see our Risk Disclosure and Performance Disclaimer Statement.
Calculation
//input = price, user defined, default is midpoint price
//period = user defined, default is 7
//quad = quadrature = imaginary part of complex number
//inPhase = real part of complex number
//index = current bar number
iMult = .635;
qMult = .338;

priorPrice = price[index-period];
//v1 = Detrend price
v1 = price - priorPrice;

v2 = v1[index-2]);
v4 = v1[index-4];

inPhase3 = inPhase[index-3];
quad2 = quad[index-2];

//Hilbert transform complex number components, inPhase (real part), quad (imaginary part)

inPhase = 1.25 * (v4 - (iMult*v2) + (iMult*inPhase3));
quad = v2 - (qMult*v1) + (qMult*quad2);
Plot1: inPhase;
Plot2: quad;