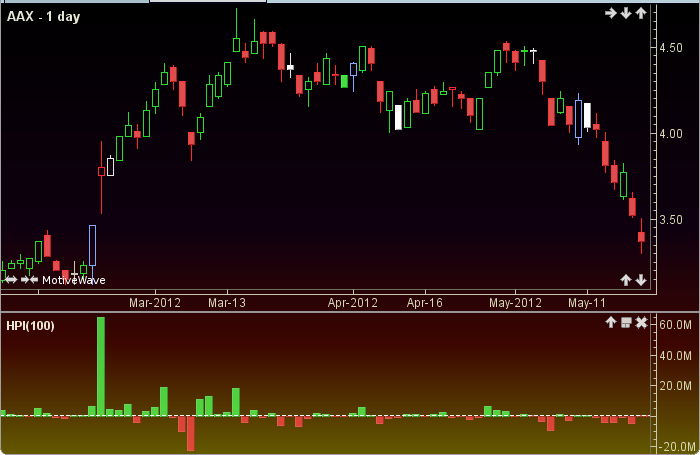
Herrick Payoff Index
The Herrick Payoff Index (HPI) was authored by John Herrick. The HPI is used to analyze futures and commodities. One input parameter called value of one percent move (pointValue) is required. Herrick recommended 100 for most commodities. A host of highs, lows, opens, closes and volume are mathematically manipulated to produce a bi-colored histogram. This indicator’s definition is further expressed in the condensed code given in the calculation below.
How To Trade Using Herrick Payoff Index
The Herrick Payoff Index may to be used in conjunction with other indicators. No trading signals are calculated.
How To Access in MotiveWave
Go to the top menu, choose Study>Volume Based>Herrick Payoff Index
or go to the top menu, choose Add Study, start typing in this study name until you see it appear in the list, click on the study name, click OK.
Important Disclaimer: The information provided on this page is strictly for informational purposes and is not to be construed as advice or solicitation to buy or sell any security. Please see our Risk Disclosure and Performance Disclaimer Statement.
Calculation
//pointValue = user defined, default is 100
//prev = previous, index = current bar number
//abs = absolute value
//LT = less than, MT = more than
prevOpen = open[index-1];
prevHigh = high[index-1];
prevLow = low[index-1];
prevClose = close[index-1];
median = (high + low) / 2;
prevMedian = (prevHigh + prevLow) / 2;
i = abs(close - prevClose);
g = min(open, prevOpen);
k = (median-prevMedian) * pointValue * volume;
temp = 1 + ((i/2) / g);
if (median LT prevMedian) temp = 1 - ((i/2) / g);
k = k * temp;
prevK = k[index-1];
PlotHist: hpic = prevK + (k - prevK);