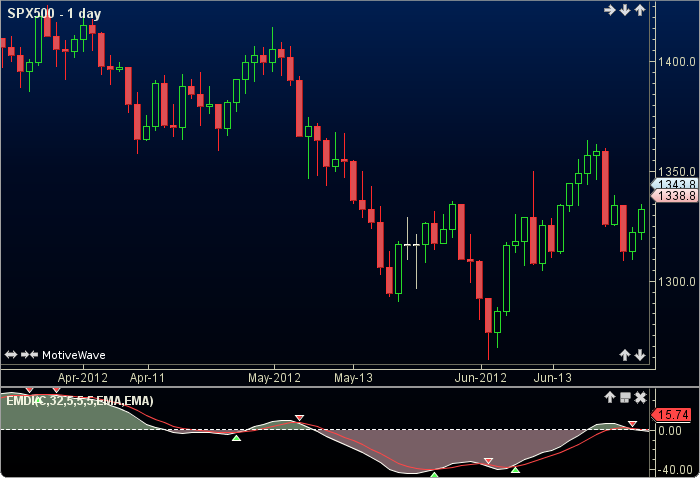
Ergodic Mean Deviation Indicator
The Ergodic Mean Deviation Indicator (EMDI) was authored by William Blau. The EMDI uses price and an exponential moving average (EMA) difference, as fodder for further EMA’s which culminate in its oscillator and signal values. The user may alter the input (close), methods (EMAs) and period lengths. This indicator’s definition is further expressed in the condensed code given in the calculation below.
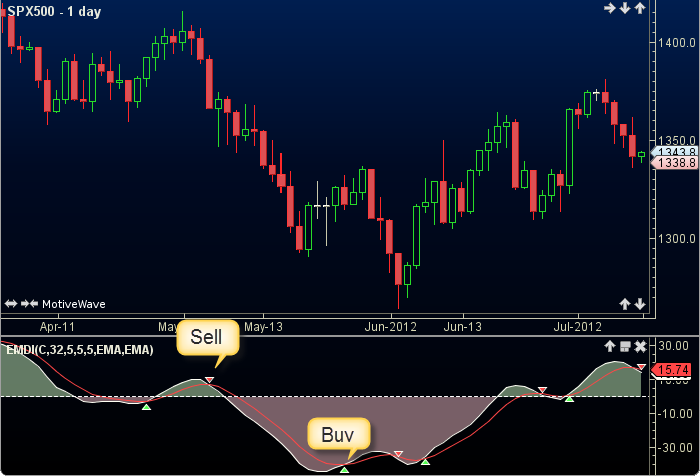
How To Trade Using Ergodic Mean Deviation Ind
A sell signal is generated when the emdi crosses below the signal line. Conversely, a buy signal is given when the emdi crosses above the signal line.
How To Access in MotiveWave
Go to the top menu, choose Study>William Blau>Erogodic Mean Deviation Ind
or go to the top menu, choose Add Study, start typing in this study name until you see it appear in the list, click on the study name, click OK.
Important Disclaimer: The information provided on this page is strictly for informational purposes and is not to be construed as advice or solicitation to buy or sell any security. Please see our Risk Disclosure and Performance Disclaimer Statement.
Calculation
//input = price, user defined, default is close
//period1 = user input, default is 32
//period2 = user input, default is 5
//period3 = user input, default is 5
//sPeriod = user input, default is 5
//method1 = moving average (ma), user defined, default is EMA
//method2 = moving average (ma), user defined, default is EMA
//sig = signal, index = current bar number
ma = ma(method1, index, period1, input);
ma1 = price - ma;
ma2 = ma(method1, index, period2, ma1);
Plot1: emdi = ma(method1, index, period3, ma2);
Plot2: sig = series.ma(method2, index, sPeriod, emdi);
//Signals
buy = crossedAbove(EMDI, SIG);
sell =crossedBelow(EMDI, SIG);