CMO Average
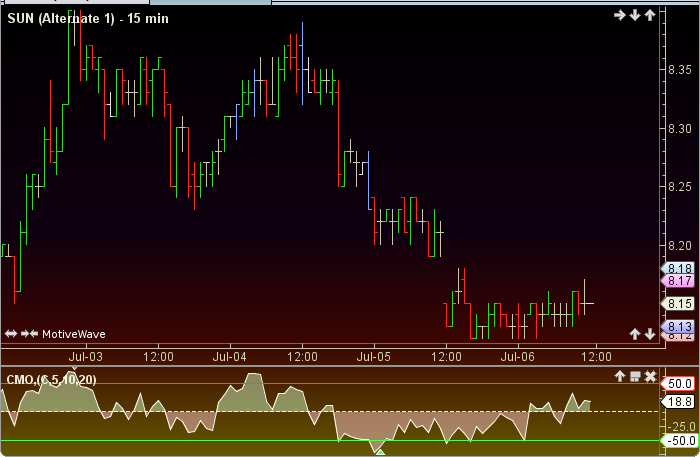
CMO Average (cmoAv) by Chande and Kroll for Omega Research 1997 is a momentum indicator. It uses data from up and down days, averages 3 summation periods and has a range of 100 to -100. Adjustable guides are given to fine tune the signals. The user may change the input (close), period lengths and guide values. This indicator’s definition is further expressed in the condensed code given in the calculation below.
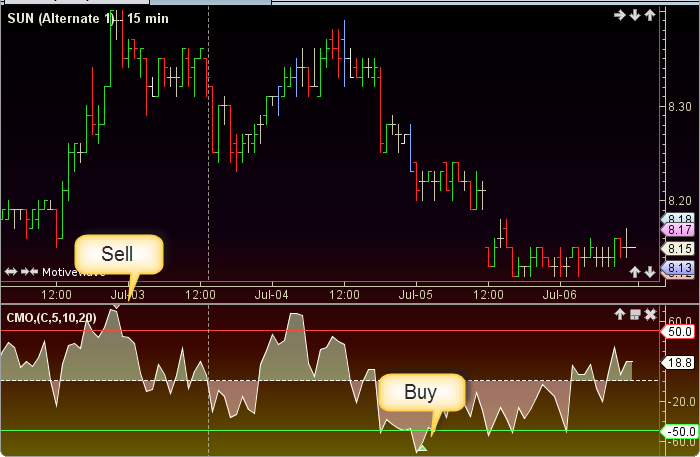
How To Trade Using CmoAv
Adjust the top and bottom guides to control the quantity and quality of the trading signals. CmoAv values above 50 are considered to be overbought and therefore offer an opportunity to sell. CmoAv values below -50 are considered oversold and present an opportunity to buy. If the cmoAv peaks above the top guide a sell signal will be generated. Conversely, if the cmoAv troughs below the bottom guide a buy signal will be given. The 0 line divides the bulls (above) from the bears (below).
How To Access in MotiveWave
Go to the top menu, choose Study>Tushar Chande>CMO Average
or go to the top menu, choose Add Study, start typing in this study name until you see it appear in the list, click on the study name, click OK.
Important Disclaimer: The information provided on this page is strictly for informational purposes and is not to be construed as advice or solicitation to buy or sell any security. Please see our Risk Disclosure and Performance Disclaimer Statement.
Calculation
//input = price (user defined, default is closing price)
//period1 = user defined, default is 5
//period2 = user defined, default is 10
//period3 = user defined, default is 20
//prev = previous, index = current bar number
//abs = absolute value
//MT = more than, LT = less than
prevValue1 = price[index-1];
minusC1 = price - prevValue1;
absMinusC1 = abs(minusC1);
sumP1 = sum(index, period1, minusC1);
absSumP1 = sum(index, period1, absMinusC1);
sumP2 = sum(index, period2, minusC1);
absSumP2 = sum(index, period2, absMinusC1);
sumP3 = sum(index, period3, minusC1);
absSumP3 = sum(index, period3, absMinusC1);
Plot: cmoAv = 100 * (((sumP1/absSumP1) + (sumP2/absSumP2) + (sumP3/absSumP3)) / 3);
//Signals
prevCmo = cmoAv[index-1];
highSell = cmoAv for last sell signal, reset to max_negative at each  buy signal;
lowBuy = cmoAv for last buy signal, reset to max_positive at each sell signal;
sell = (cmoAv MT topGuide) AND (prevCmo MT cmoAv) AND (cmoAv MT highSell);
buy = (cmoAv LT bottomGuide AND prevCmo LT cmoAv)  AND (cmoAv LT lowBuy);