Choppiness Index
The Choppiness Index (CI) was authored by Australian commodity trader E.W. Dreiss. The CI may be used to determine if the market is consolidating or trending. The user may change the period length and guide values. This indicator’s definition is further expressed in the condensed code given in the calculation below.
How To Trade Using the Choppiness Index
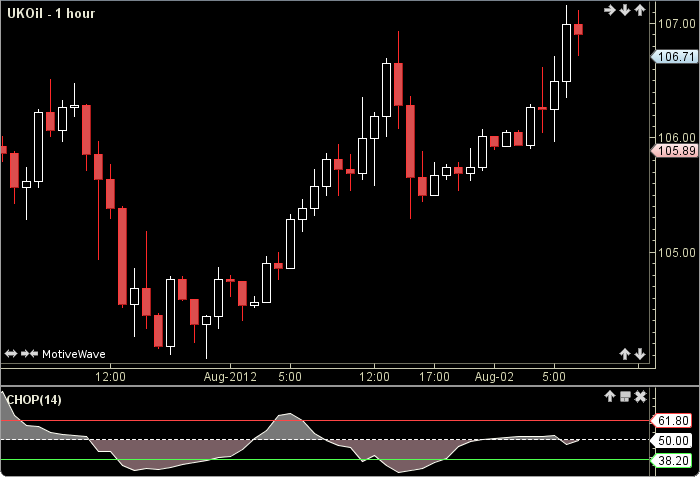
The Choppiness Index is a directionless indicator. Values above the top guide (61.8) indicate that the market is moving sideways in a ranging or choppy manner. Values below the bottom guide (38.2) indicate the market is trending. The Choppiness Index is best used in conjunction with other studies. No trading signals are calculated for this indicator.
How To Access in MotiveWave
Go to the top menu, choose Study>Oscillators>Choppiness Index
or go to the top menu, choose Add Study, start typing in this study name until you see it appear in the list, click on the study name, click OK.
Important Disclaimer: The information provided on this page is strictly for informational purposes and is not to be construed as advice or solicitation to buy or sell any security. Please see our Risk Disclosure and Performance Disclaimer Statement.
Calculation
//period = user defined, default is 14
//top guide = user defined, default is (fibonacci number) 61.8
//bottom guide = user defined, default is (fibonacci number) 38.2
//index = current bar number
   atr = atr(index, period);
   total = sum(index, period, ATR);
   lowest = lowest(index, period, LOW);
   highest = highest(index, period, HIGH);
   diff = highest - lowest;
   temp = (total/diff);
   Plot: chop = 100 * Math.log10(temp) / Math.log10(period);