Bollinger Bands®
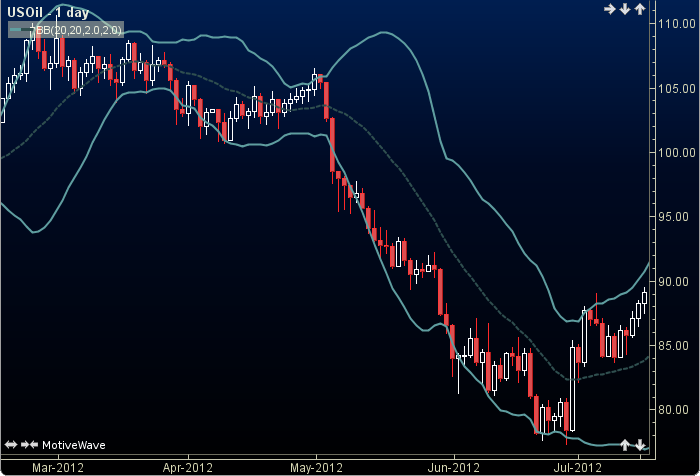
Bollinger Bands® was authored by John Bollinger in the 1980s. Bollinger Bands® can be used to measure the highness or lowness of the price relative to previous trades. The user may change the input (close), period lengths, shift and standard deviation factors. This indicator’s definition is further expressed in the code given in the calculation below.
Click here for more information.
How To Trade Using Bollinger Bands®
No trading signals are given for this indicator.
How To Access in MotiveWave
Go to the top menu, choose Study>Overlays>Bollinger Bands®
or go to the top menu, choose Add Study, start typing in this study name until you see it appear in the list, click on the study name, click OK.
Important Disclaimer: The information provided on this page is strictly for informational purposes and is not to be construed as advice or solicitation to buy or sell any security. Please see our Risk Disclosure and Performance Disclaimer Statement.
Calculation
//input = price, user defined, default is close
//Top Period = user defined, default is 20
//Bottom Period = user defined, default is 20
//Shift = user selection, default is 0
//Standard Deviation Top = factor, user defined, default is 2
//Standard Deviation Bottom = factor, user defined, default is 2
//LT = less than, MT = more than
//LOR= less or equal, MOR= more or equal
    end = series.size()-1;
    if (topShift LT 0) end -= topShift; //Calculate future values
     //Calculate top and middle lines
     for(int i = topPeriod; i LOR= end; i++)
      stdDev = std(i, topPeriod, input);
      ma = sma(i, topPeriod, input);
      Plot2: plot(i+topShift, ma);
      Plot1: plot(i+topShift, ma + stdDev*topStd);
     endFor
     //Calculate bottom line
    end = latest;
    if (bottomShift LT 0) end -= bottomShift; //Calculate future values
    for(int i = bottomPeriod; i LOR= end; i++)
      stdDev = std(i, bottomPeriod, input);
      ma = sma(i, bottomPeriod, input);
      if (stdDev == null OR ma == null) continue;
      Plot3: plot(i+bottomShift, ma - stdDev*bottomStd);
    endFor