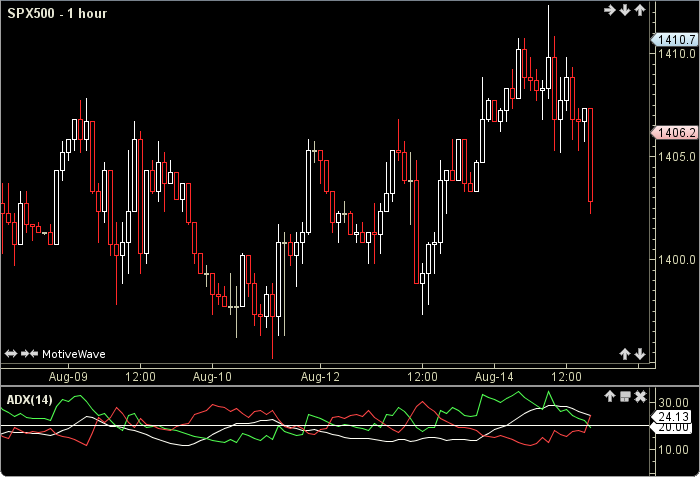
Average Directional Index (ADX)
The Average Directional Index (ADX) was authored by J. Welles Wilder in 1978. ADX is an indicator of trend strength in a series of prices. It is composed of two other indicators, the positive directional indicator (+DI) and the negative directional indicator (-DI). The ADX combines and smooths these indicators. The user may change only the period length. This indicator’s definition is further expressed in the condensed code given in the calculation below.
Click here for more information.
How To Trade Using Average Directional Index (ADX)
The Average Directional Index (ADX) may be used in conjuction with other studies. No signals are calculated for this indicator.
How To Access in MotiveWave
Go to the top menu, choose Study>Welles Wilder>Average Directional Index
or go to the top menu, choose Add Study, start typing in this study name until you see it appear in the list, click on the study name, click OK.
Important Disclaimer: The information provided on this page is strictly for informational purposes and is not to be construed as advice or solicitation to buy or sell any security. Please see our Risk Disclosure and Performance Disclaimer Statement.
Calculation
//period = user defined, default is 14
//index = current bar number
//smma = smoothed moving average
//abs = absolute value
// Calculate the +DM, -DM and TR
pDM = getPositiveDM(index);
nDM = getNegativeDM(index);
tr = getTrueRange(index);
// Calculate the Average +DM, -DM and TR
PDMa = smma(index, period, PDM);
NDMa = smma(index, period, NDM);
TRa = smma(index, period, TR);
// Determine the +DI, -DI and DX
Plot1: PDI = PDMa / TRa * 100;
Plot2: NDI = NDMa / TRa * 100;
DX = Math.abs((PDMa - NDMa)) / (PDMa + NDMa) * 100;
// Calculate the Average DX
Plot3: ADX = smma(index, period, DX);