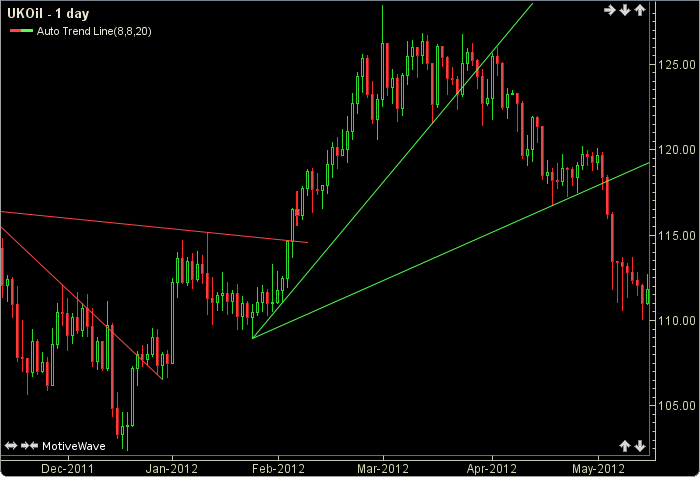
Auto Trend Line
The Auto Trend Line automatically draws trend lines based on swing high and swing low points. Swing points are determined as the highest high (or lowest low) over the range (index – high_period, index + high_period). Trend lines are draw by connecting two consecutive points that have positive slope for low points and negative slope for high points. The user may change the period lengths. This indicator’s definition is further expressed in the condensed code given in the calculation below.
How To Trade Using Auto Trend Line
No trading signals are calculated for this indicator.
How To Access in MotiveWave
Go to the top menu, choose Study>Overlays>Auto Trend Line
or go to the top menu, choose Add Study, start typing in this study name until you see it appear in the list, click on the study name, click OK.
Important Disclaimer: The information provided on this page is strictly for informational purposes and is not to be construed as advice or solicitation to buy or sell any security. Please see our Risk Disclosure and Performance Disclaimer Statement.
Calculation
//period1 = user defined, default is 8
//period2 = user defined, default is 8
//period3 = user defined, default is 20
//multiple lines = user defined, default is true
//historical lines = user defined, default is false
Code may be available on request.