ATR Trailing Stops
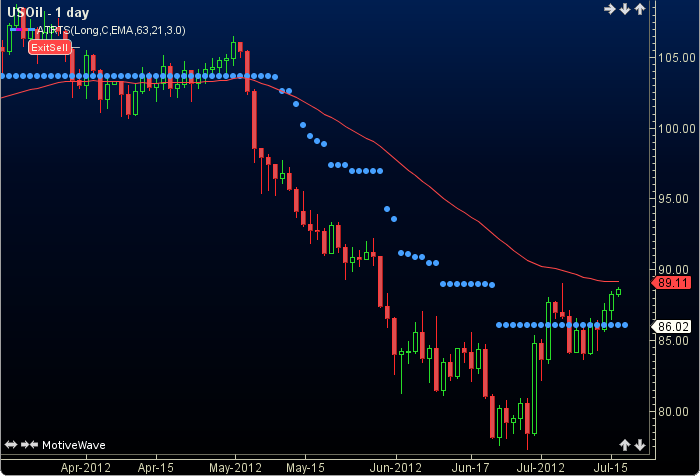
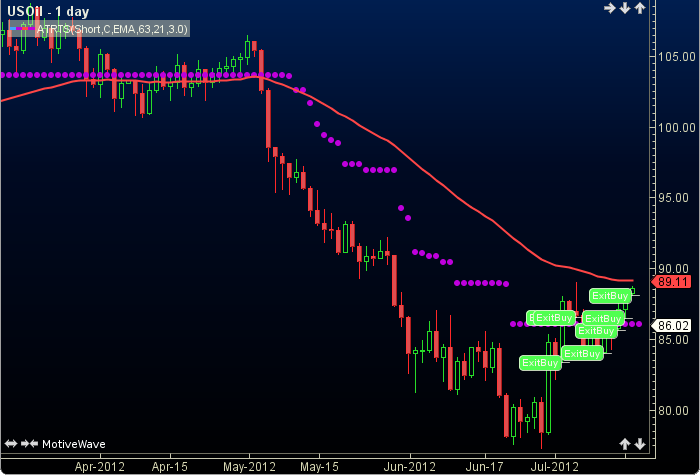
ATR Trailing Stops (ATRTS) identifies exit points for long and short positions. First, an exponential moving average (EMA) of the input is taken to determine the current trend. Then, the Average True Range (ATR) is calculated and multiplied by a user defined factor. If the EMA is increasing (uptrend), the ATR product is subtracted from the price or, if the EMA is decreasing (down trend), it is added to the price, and along with a few details the ATRTS is formed. The user may change the position (long), input (close), method (EMA), period lengths, percent factor and show entry option(see trading signals below). This indicator’s definition is further expressed in the condensed code given in the calculation below.
How To Trade Using ATR Trailing Stops
ATR Trailing Stops are designed to aid in exit decisions. For long positions, if the price is less than the ATRTS a sell signal is generated. Conversely for short positions, if the price is more than the ATRTS a buy to cover signal will be given. The user may also chose to show entry signals, however they should only be used with a trend filter.
How To Access in MotiveWave
Go to the top menu, choose Study>Exit Strategies>ATR Trailing Stops
or go to the top menu, choose Add Study, start typing in this study name until you see it appear in the list, click on the study name, click OK.
Important Disclaimer: The information provided on this page is strictly for informational purposes and is not to be construed as advice or solicitation to buy or sell any security. Please see our Risk Disclosure and Performance Disclaimer Statement.
Calculation
//position = pos, user defined, default is long
//input = price, user defined, default is close
//method = moving average (ma), user defined, default is EMA
//period1 = maP, user defined, default is 63
//period2 = artP, user defined, default is 21
//factor = fac, user defined, default is 3
//show entrys = showE, user defined, default is false
//index = current bar number, prev = previous
//LOE = less or equal, MOE = more or equal
//shortP = short position, longP = long position
//index = current bar number
longP = pos == "Long";
shortP = pos == "Short";
atrts = 0, atr = 0;
ma = ma(method, maP, input);
prevP = price[index-1];
prevA = ifNull(price, atrts[index]); //current atrts is plotted at index+1
upTrend = price moreThan ma;
dnTrend = price LOE ma;
atr = atr(index, atrP);
if (upTrend)
    atrts = price - fac * atr;
    if (atrts lessThan prevA) atrts = prevA;
endIf
if (dnTrend)
    atrts = price + fac * atr;
    if (atrts moreThan prevA) atrts = prevA;
endIf
Plot: atrts[index+1];
//Signals
sell = false, buy = false;
if (atrts != 0)
    if (longP AND upTrend)
        sell = price lessThan atrts;   //sell to exit
        buy = prevP lessThan atrts AND price moreThan atrts AND showE;  //buy (enter)
    endIf
    if (shortP AND dnTrend)
        sell = prevP moreThan atrts AND price lessThan atrts  AND showE;   //sell short (enter)
        buy = price moreThan atrts;  //buy to cover
    endIf
endIf