Aroon
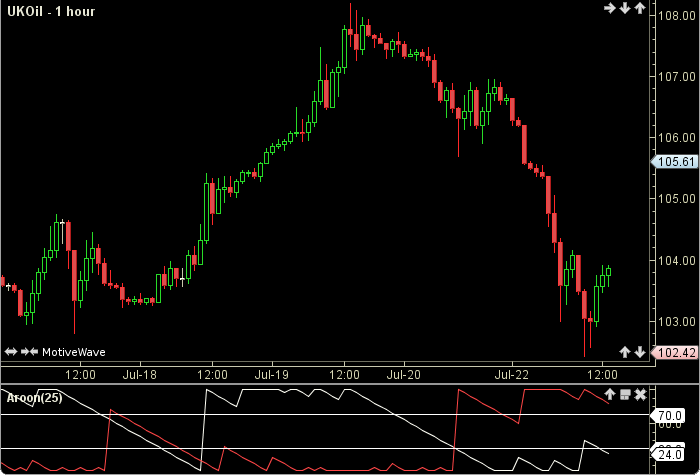
The Aroon was authored by Tushar Chande in 1995. Aroon may be used to determine if an instrument is trending and how strong the trend is. The indicator system consists of two lines Aroon(up) and Aroon(down). The user may change the period length. This indicator’s definition is further expressed in the condensed code given in the calculation below.
How To Trade Using Aroon
No trading signals are calculated for this indicator
How To Access in MotiveWave
Go to the top menu, choose Study>Tushar Chande>Aroon
or go to the top menu, choose Add Study, start typing in this study name until you see it appear in the list, click on the study name, click OK.
Important Disclaimer: The information provided on this page is strictly for informational purposes and is not to be construed as advice or solicitation to buy or sell any security. Please see our Risk Disclosure and Performance Disclaimer Statement.
Calculation
//period = user defined, default = 25
//MOE = more or equal, LOE = less or equal
//index = current bar number
high_ind = 0;
low_ind = 0;
highest = NEGATIVE_INFINITY;
lowest = POSITIVE_INFINITY;
// Find the periods for the highest high and lowest low
n = period;
for(i = index-period+1; i LOE index; i++)
    bhigh = getHigh(i),
    blow = getLow(i);
    if (bhigh MOE highest)
        highest = bhigh;
        high_ind = n;
    endIf
    if (blow LOE lowest)
        lowest = blow;
        low_ind = n;
    endIf
    n--;
endFor
high_ind--;
low_ind--;
Plot1: up = ((period - high_ind)/period) * 100;
Plot2: down = ((period - low_ind)/period) * 100;