How To Use The Elliott Wave Study
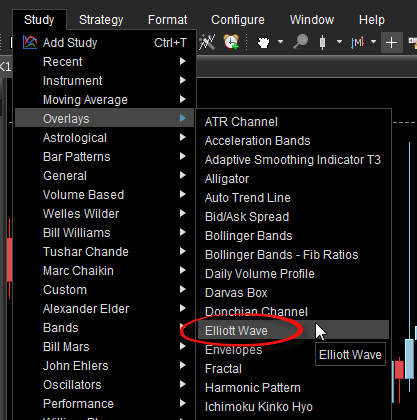
To use the Elliott Wave study in MotiveWave, Choose Study -> Overlays ->Elliott Wave from the Console menu.
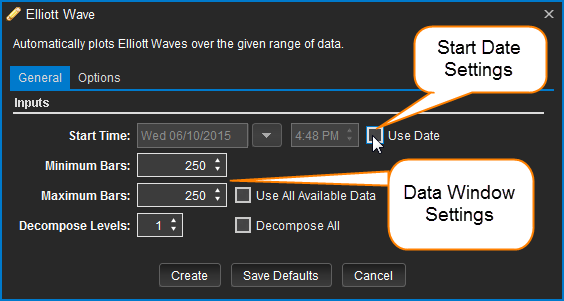
Upon adding or editing the Elliott Wave study, you will see a study dialog similar to the one displayed below.
The Elliott Wave study can automatically plot Elliott Waves based on a data window or by a specific start time and date. To define a data window, configure the Minimum Bars, Maximum Bars and All Available Data settings. To use a specific time and date, select the Use Date setting and set your start time and date.
Data Window vs Start Date
Data Window
It is possible to have varying wave count results while using the Elliott Wave study, especially when using a data window (i.e. a look back period of 250 bars, which is the default). MotiveWave® will look for a significant high or low within the specified period to calculate and initiate the wave count. As new data presents itself, the data window may shift forward respecting its' Minimum Bars and Maximum Bars values.
In the following example, an initial starting point was determined at a significant low (Figure 1) within the 250 bar data window. As new data presented itself, the data window shifted to the right as the Elliott Wave study recalculated and plotted the new wave count (Figure 2).
Figure 1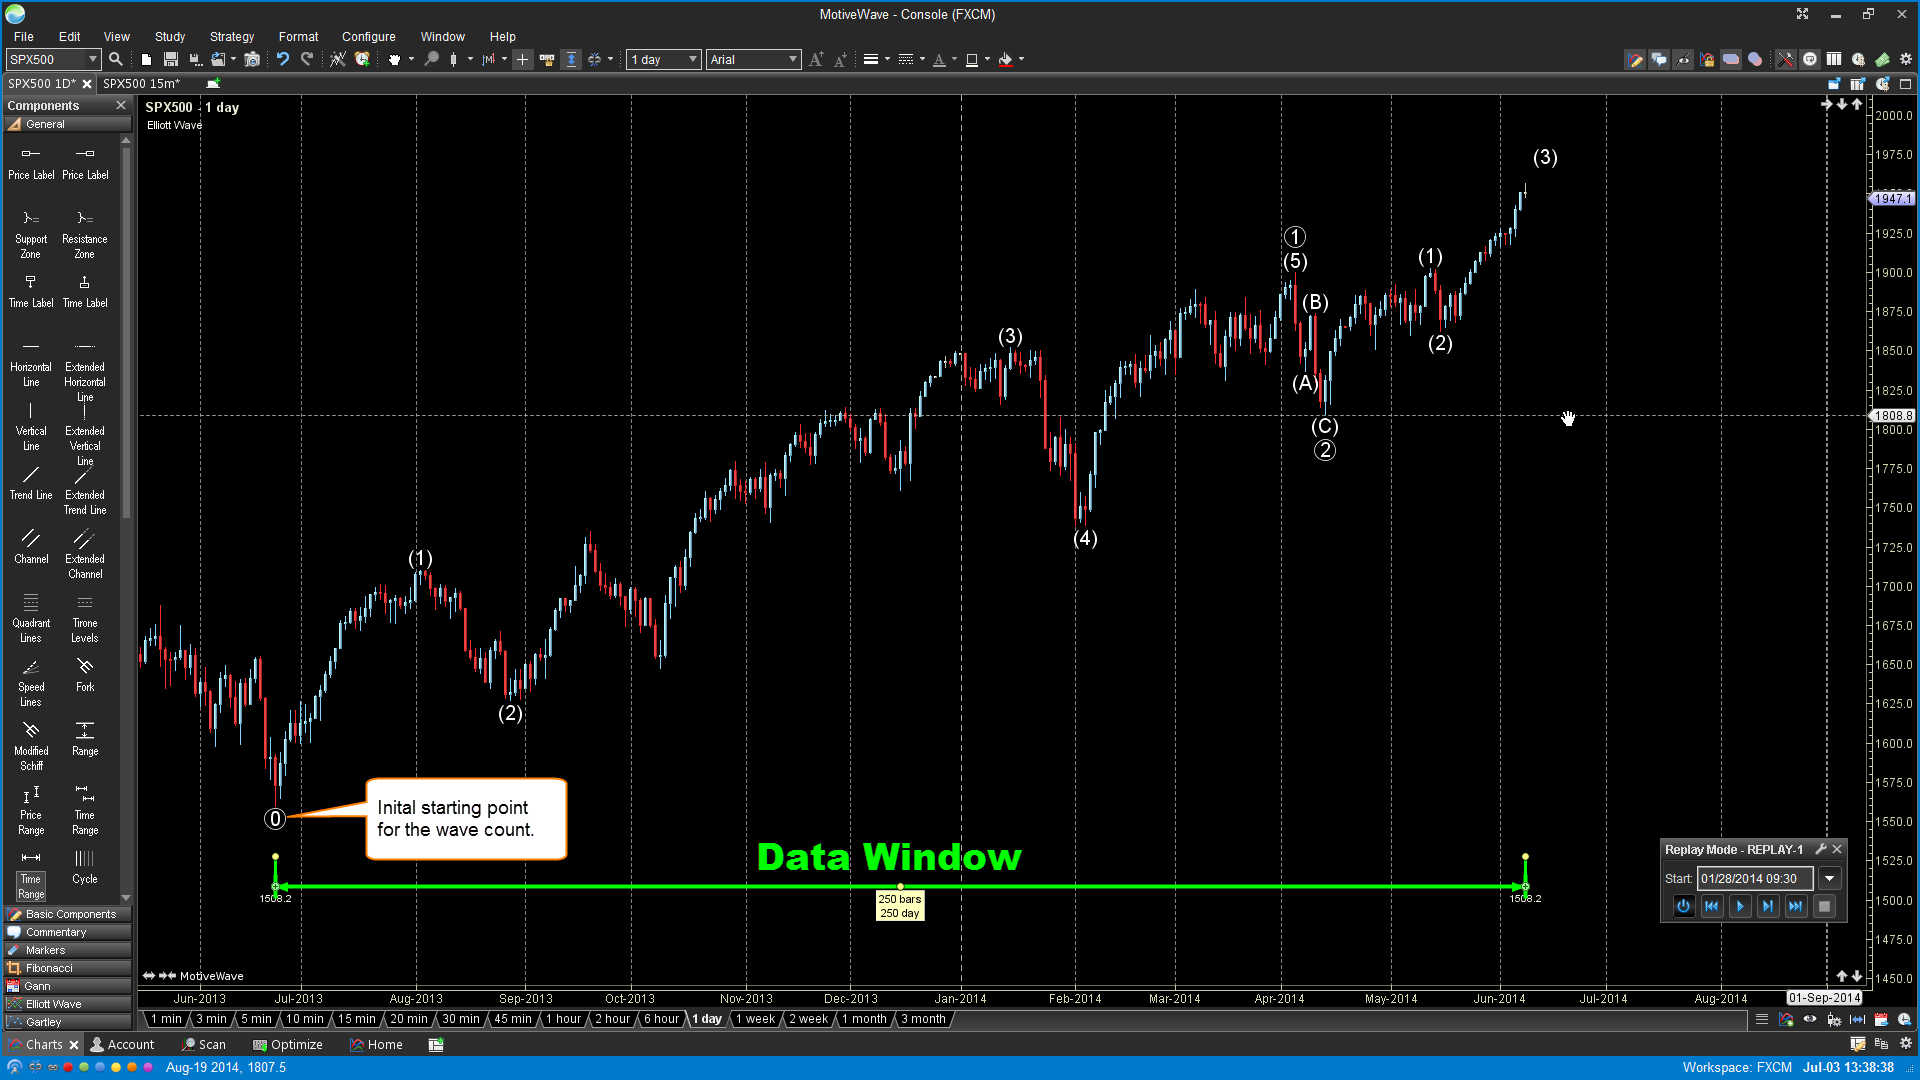
Figure 2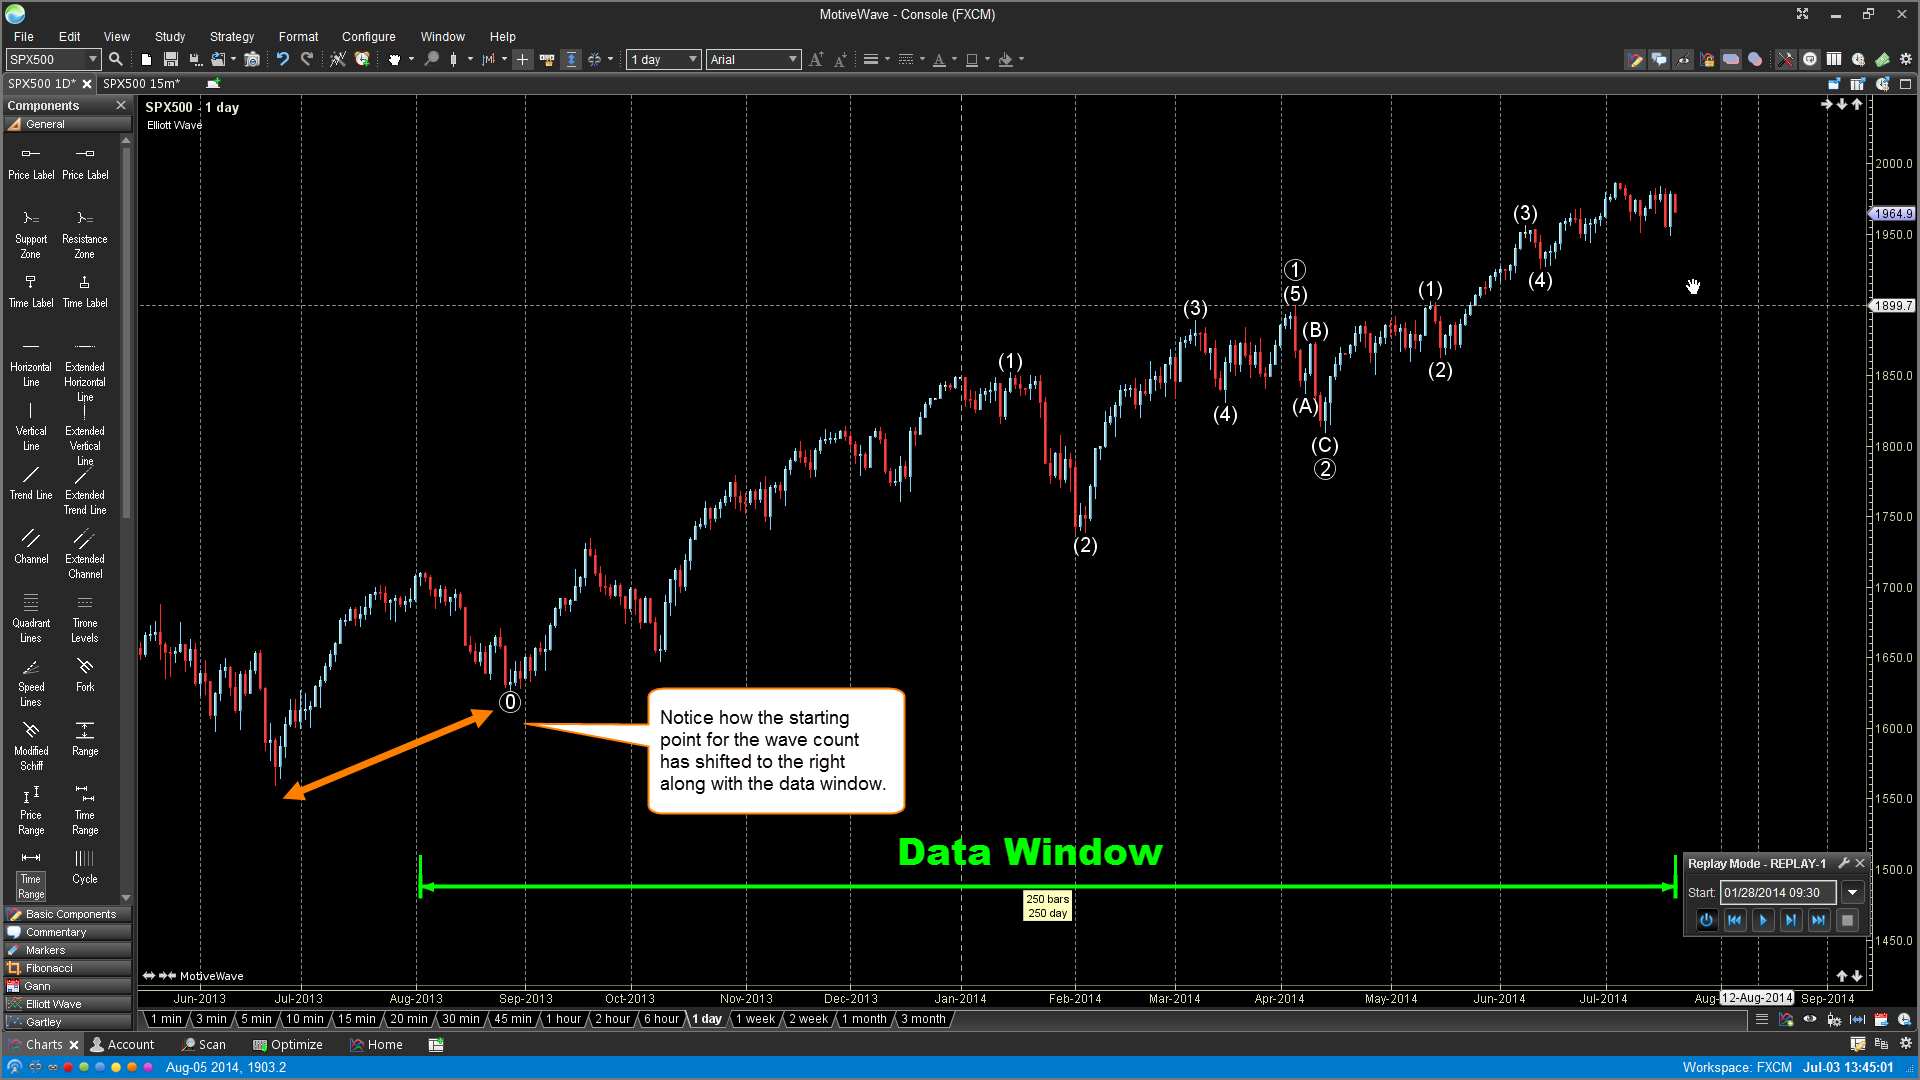
Here is an example of a daily chart (Figure 3) and 1 hour chart (Figure 4) of the same instrument. The Elliott Wave study in both instances has a data window setting of 250 bars set for both the Minimum Bars and Maximum Bars settings.
Notice that the Elliott Wave count on the daily chart initiates at the most significant low within the 250 daily bar data window while on the hourly chart, it initiates at the most significant high within its' 250 hourly bar data window. With data windows, MotiveWave will calculate the look back period based on the latest bars. In this case, 250 bars.
Figure 3 - Daily Chart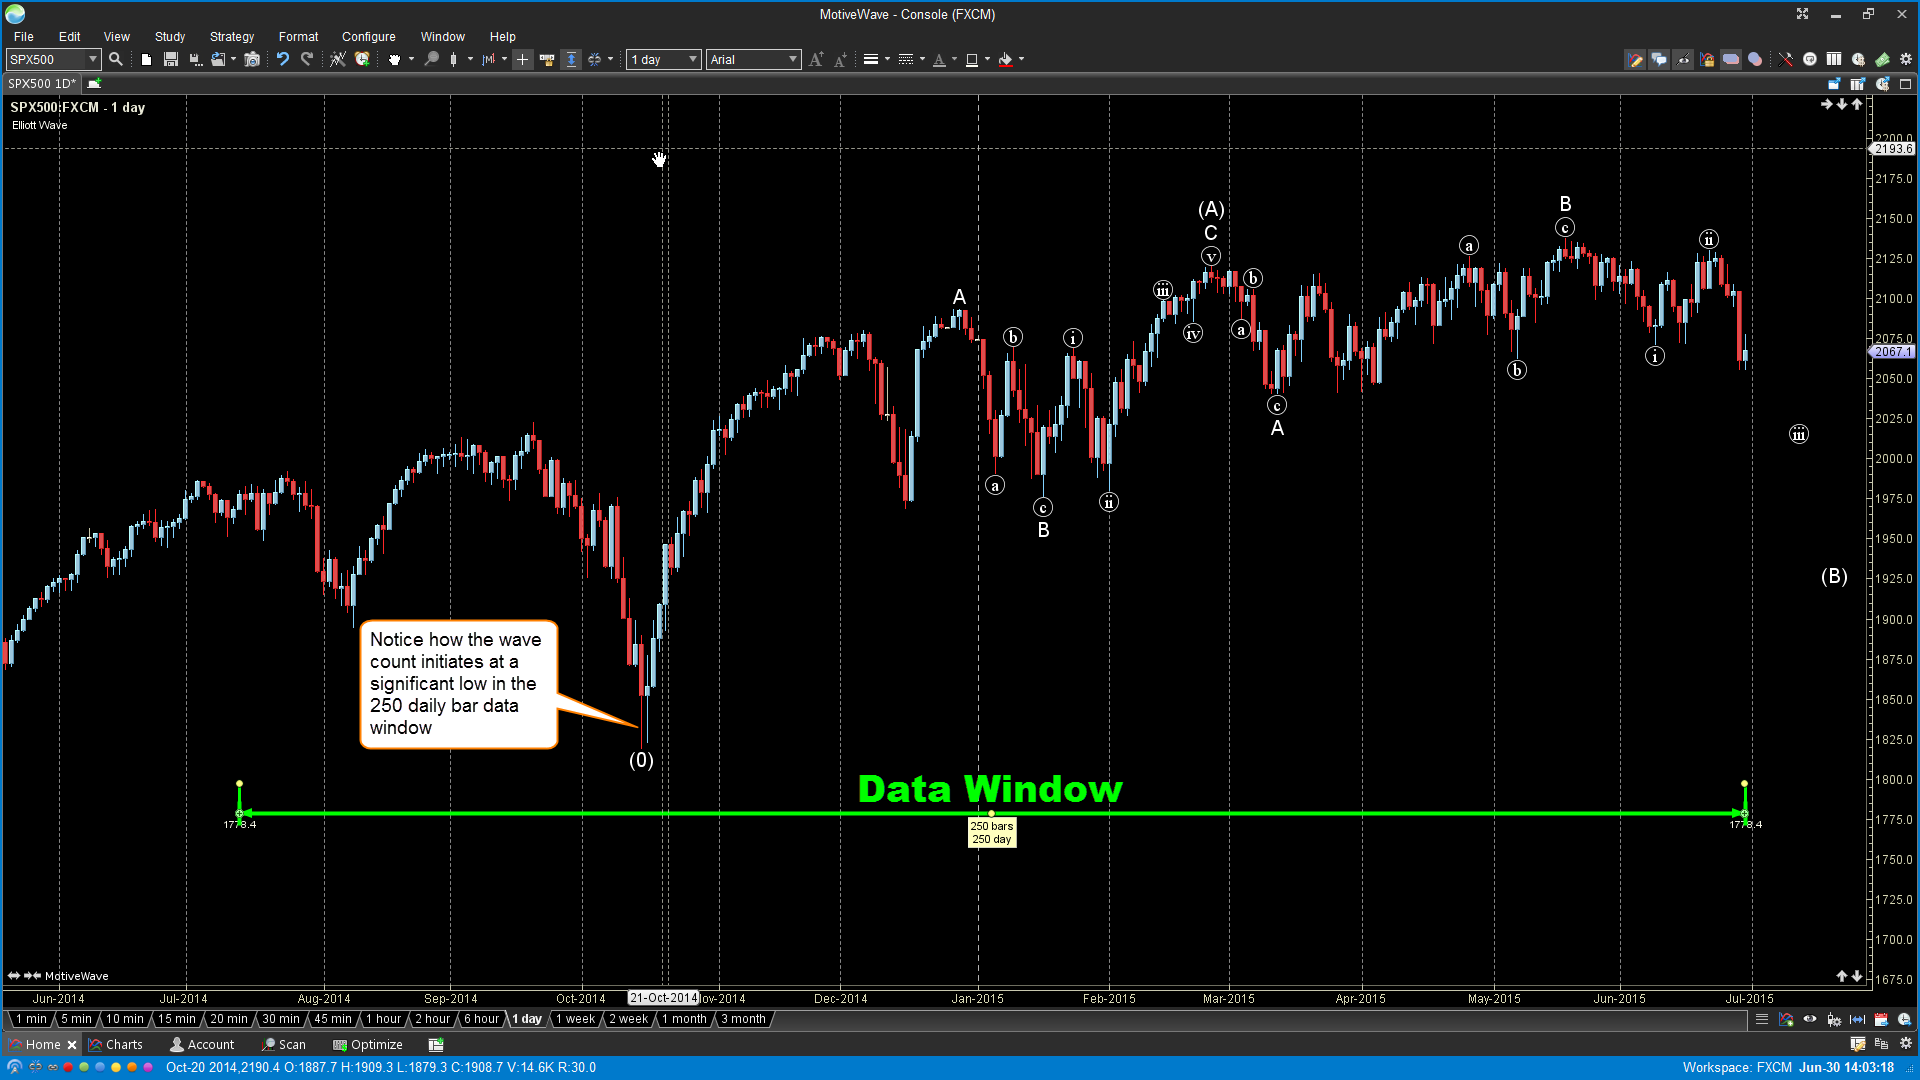
Figure 4 - Hourly Chart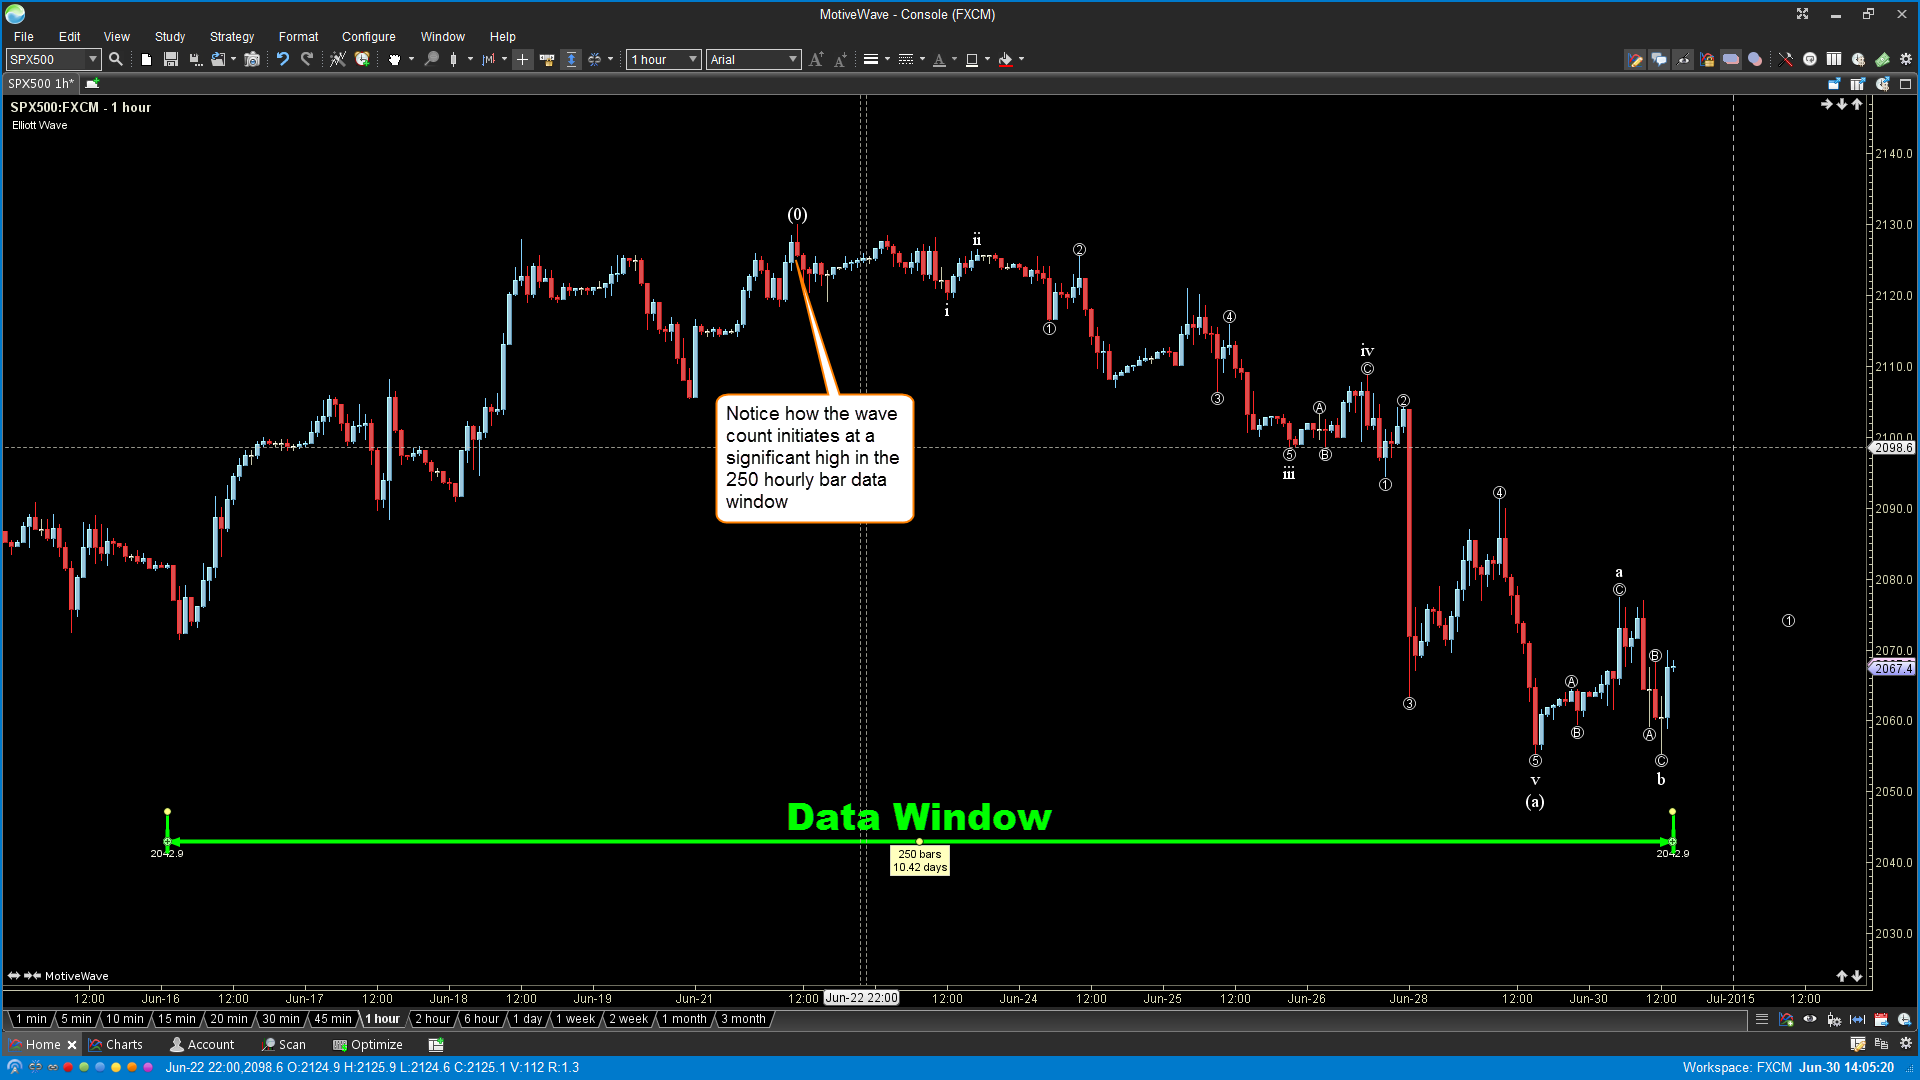
Start Date
For a more consistent wave count, you can specify a start date. As with data windows, it is important that the data range contains a significant high or low in the past. Using a start date uses all available bars from the specified date up to the present bar. Unlike the data window, the look back period does not shift but instead includes all newly presented bars as part of the data range.
Please be aware that specifying a start date can cause a lot of data to load if you are changing the time frame on the chart. For example if you set a start date to be a year or two in the past on a daily chart and then switch to a 1 min chart, MotiveWave will attempt to load 2 years of minute data, which can take a long time.
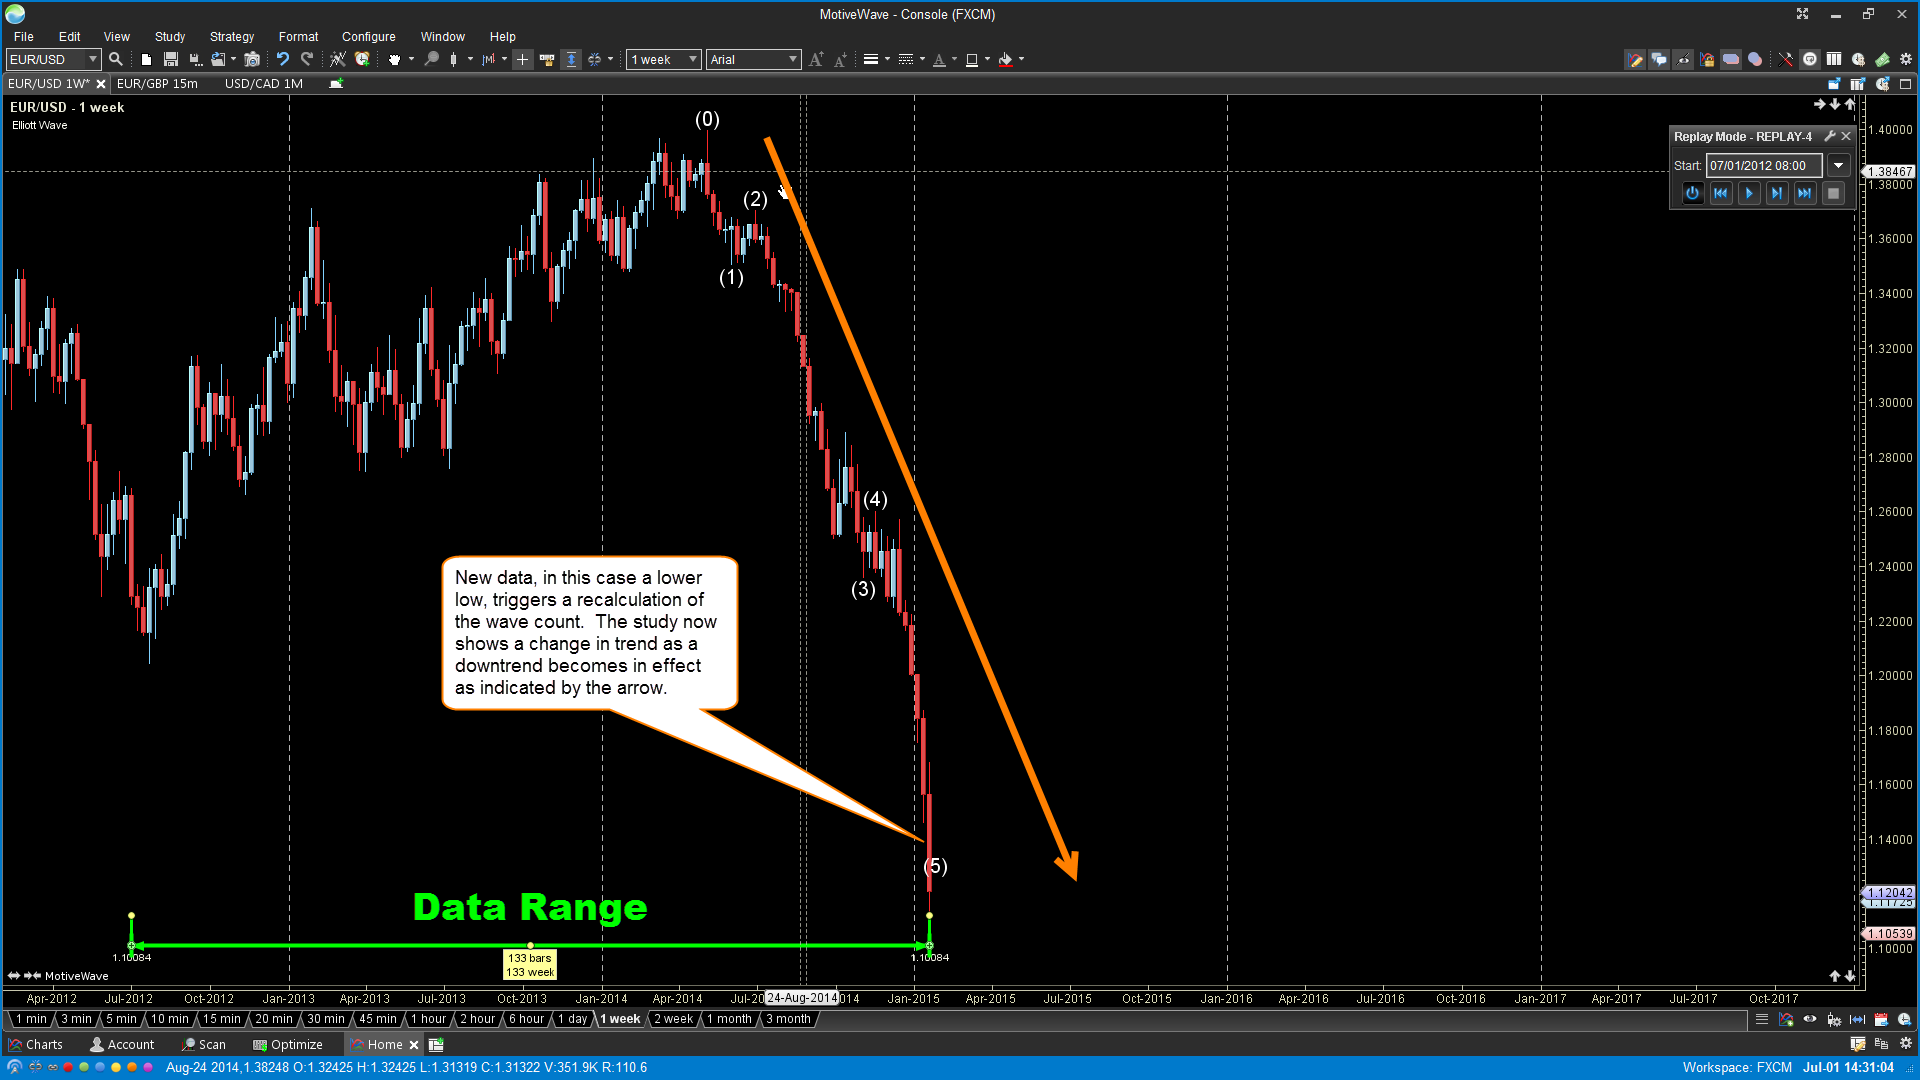
In the EUR/USD example below (Figure 5), the initial wave count was in an uptrend as determined by the Elliott Wave study. As new bar data presents itself in the data range, the Elliott Wave study evaluates whether or not a change is required in the plotted wave count.
In last chart below (Figure 6), new data as a lower low presents itself in the data range, which triggers a trend change. The Elliott Study now determines that a downtrend is in effect and displays the wave count accordingly to reflect the new state.
Figure 5 - Uptrend Using Start Date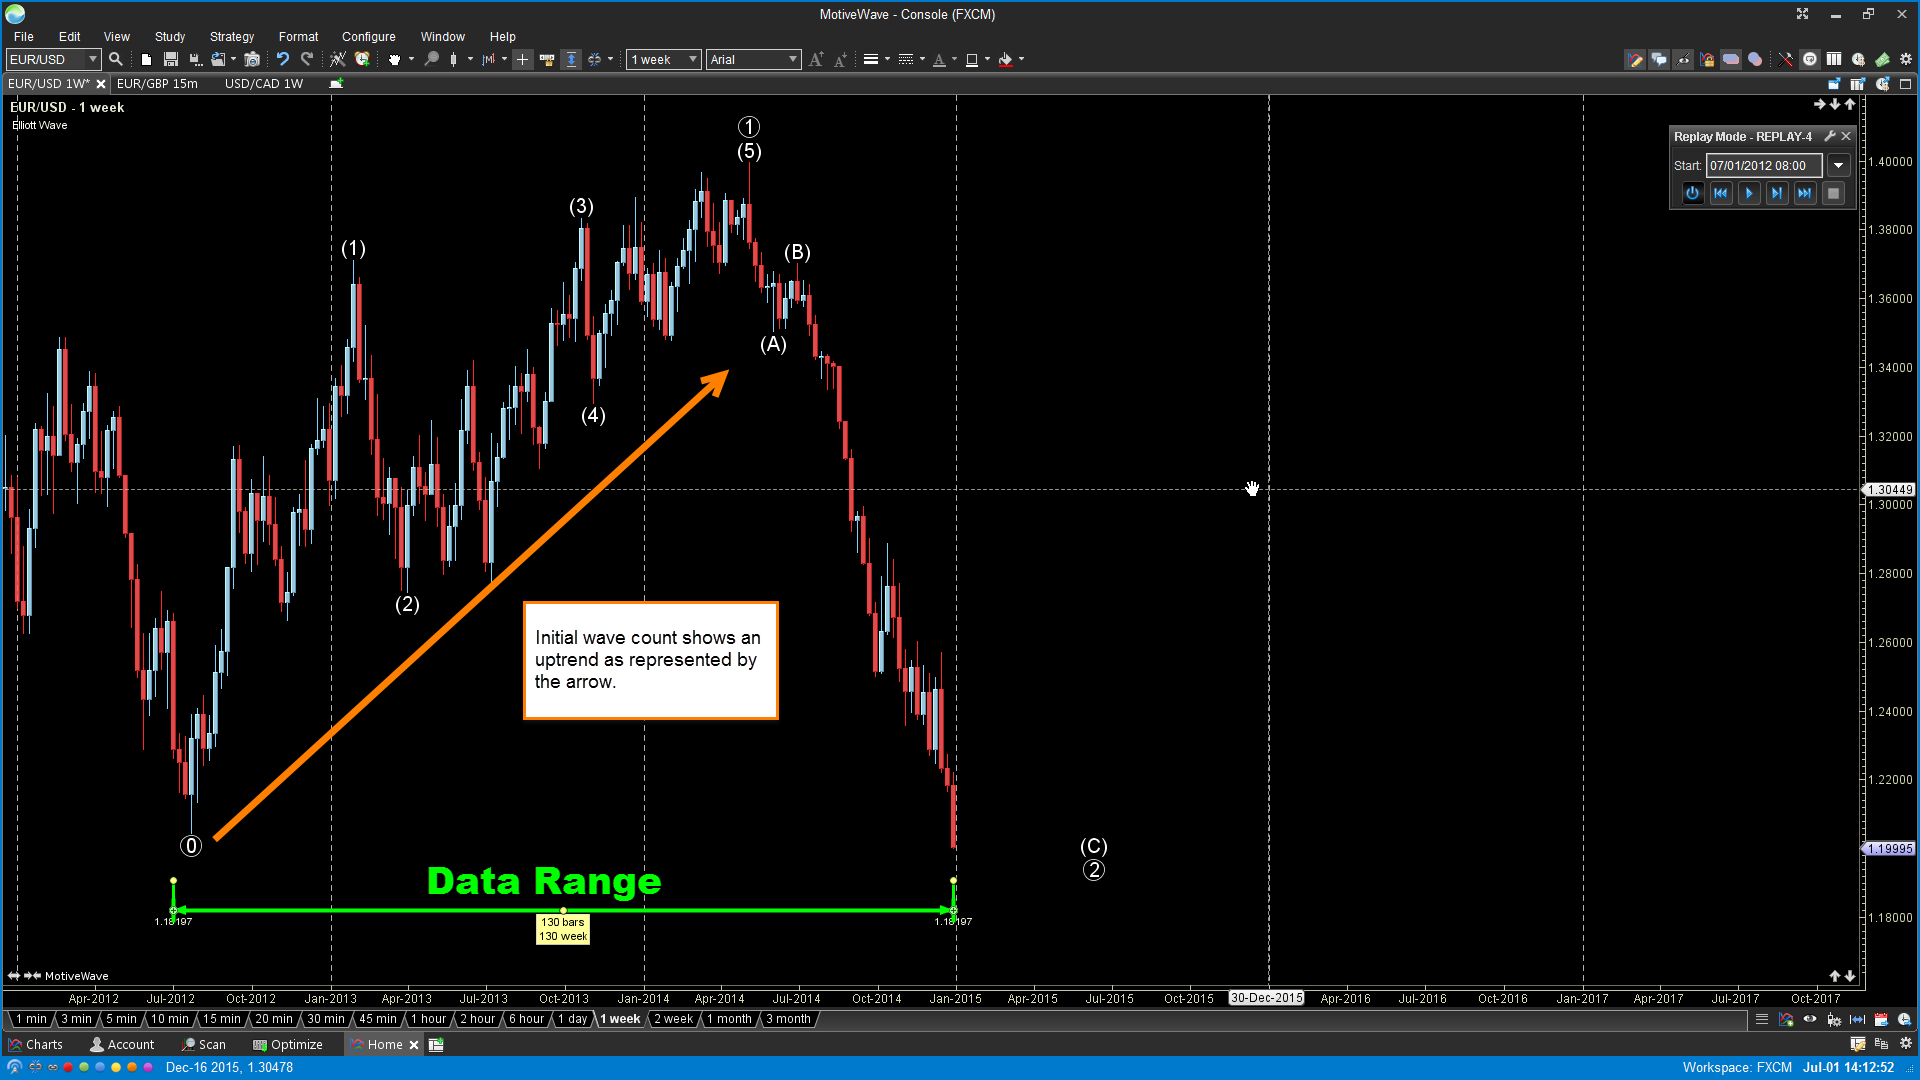
Figure 6 - Downtrend using Start Date