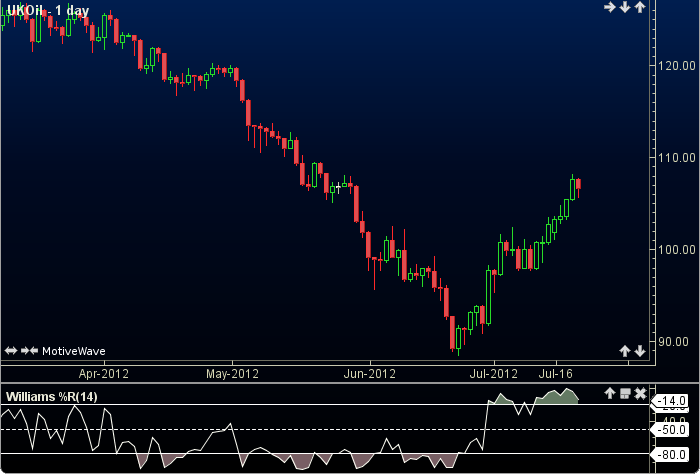
Williams %R
The Williams %R (WR) was developed by Larry Willams. WR is a momentum indicator that shows the current closing price in relation to the highest and lowest price of the past N days. The user may change the period length. This indicator’s definition is further expressed in the condensed code given in the calculation below.
Click here for more information.
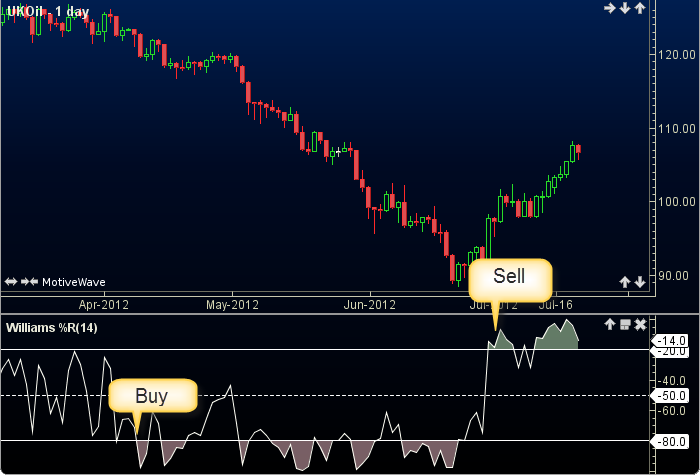
How To Trade Using Williams %R
The WR is a momentum indicator. Adjust the top and bottom guides to control the quantity and quality of the trading signals. If the WR crosses above the top guide a sell signal will be generated. Conversely, if the WR crosses below the bottom guide a buy signal will be given.
How To Access in MotiveWave
Go to the top menu, choose Study>General>Williams %R
or go to the top menu, choose Add Study, start typing in this study name until you see it appear in the list, click on the study name, click OK.
Important Disclaimer: The information provided on this page is strictly for informational purposes and is not to be construed as advice or solicitation to buy or sell any security. Please see our Risk Disclosure and Performance Disclaimer Statement.
Calculation
//period = user defined, default is 14
//index = current bar number
// Find the highest high and lowest low over the period
highest = highest(index, period, HIGH);
lowest = lowest(index, period, LOW);
WR = ((high - close) / (high - low)) * (-100);
// Signals
buy = crossedAbove(WR, topGuide);
sell = crossedBelow(WR, bottomGuide);