Trend Momentum Volatility Volume
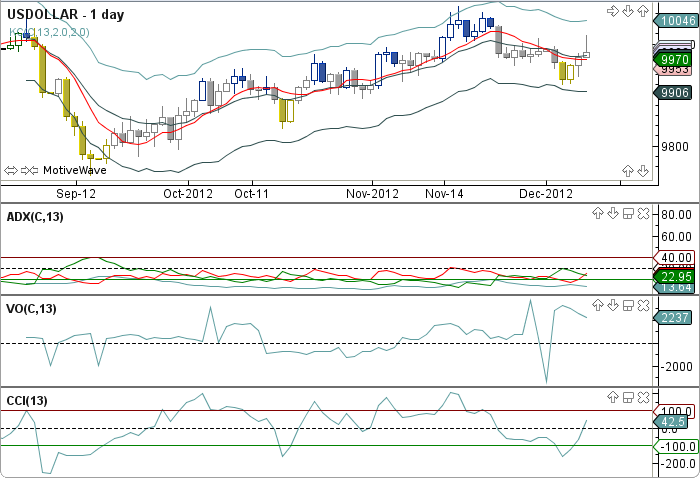
Trend Momentum Volatility Volume (TMV) was authored by Barbara Star in the Stocks and Commodities Magazine, Feb. 2012. The TMV displays five indicators, Keltner Channels (KC), Commodity Channel Index (CCI), the Volume Oscillator (VO), Average Directional Index (ADX) and a Simple Moving Average (SMA). The price bars change color based on the ADX and the SMA. The user may change multiple input values. This indicator’s definition is further expressed in the condensed code given in the calculation below.
How To Trade Using TMV
No trading signals are calculated for this indicator.
How To Access in MotiveWave
Go to the top menu, choose Add Study, start typing in this study name until you see it appear in the list, click on the study name, click OK.
Important Disclaimer: The information provided on this page is strictly for informational purposes and is not to be construed as advice or solicitation to buy or sell any security. Please see our Risk Disclosure and Performance Disclaimer Statement.
Calculation
//input = price, user defined, default is closing price
//cciPeriod = CCI period, user defined, default is 2
//kPeriod = Keltner period, user defined, default is 2
//upperRange = Keltner Upper Range, default is 2
//lowerRange = Keltner Lower Range, default is 2
//volMethod = Volume moving average method, default is SMA
//fastPeriod = Volume fast period, default is 1
//slowPeriod = Volume slow period, default is 20
//adxPeriod = ADX period, defualt is 10
//smaPeriod = SMA period, default is 8
//index = current bar number
Plot: sma = series.sma(index, smaPeriod, input);
//CCI
Plot: cci = cci(series, index, cciPeriod);

//Start ADX
//Calculate the +DM, -DM and TR
pDm = series.getPositiveDM(index);
nDm = series.getNegativeDM(index);
tr = series.getTrueRange(index);

//Calculate the Average +DM, -DM and TR
pdMa = series.smma(index, adxPeriod, PDM);
ndMa = series.smma(index, adxPeriod, NDM);
tra = series.smma(index, adxPeriod, TR);

//Determine the +DI, -DI and DX
pdi = pdMa / tra * 100;
ndi = ndMa / tra * 100;
dx = abs((pdMa - ndMa)) / (pdMa + ndMa) * 100;

 //Calculate the Average DX
Plot: adx = series.smma(index, adxPeriod, DX);
prevAdx = adx[index-1];
 //End ADX

 //Keltner Channels
Plot: middle = series.ma(EMA, index, kPeriod, input);
atr = series.atr(index, kPeriod);
Plot: top = middle + (upperRange * atr);
Plot: bottom = middle - (lowerRange * atr);

//Volume Oscillator
ma1 = series.ma(volMethod, index, fastPeriod, VOLUME);
ma2 = series.ma(volMethod, index, slowPeriod, VOLUME);
Plot: vo = ma1 - ma2;
up = adx moreThan prevAdx AND price moreThan sma;
down = adx moreThan prevAdx AND price lessThan sma;
if (up) series.setPriceBarColor(index, upColor);
if (down) series.setPriceBarColor(index, downColor);
if (!up AND !down) series.setPriceBarColor(index, neutralColor);