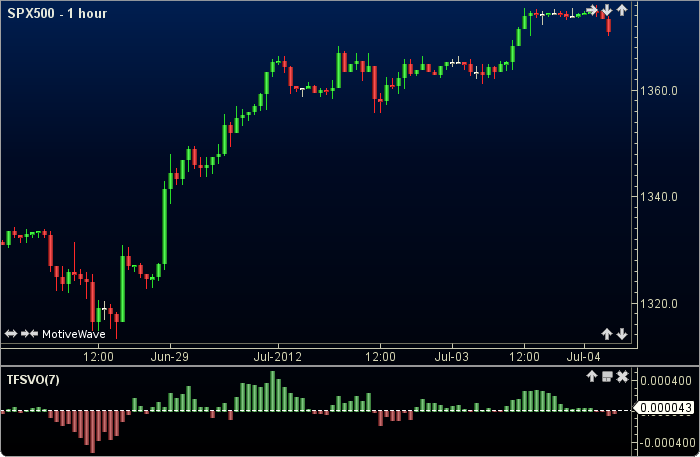
TFS Volume Oscillator
TFS Volume Oscillator was authored by Bryan Strain in Stocks and Commodities Magazine 06/2000. First, the bar volume for the period is tallied as a plus or minus dependant upon a predominant open (-) or closing (+) price. This tally is then divided by the period to produce the volume oscillator plot. The user may change the period length. This indicator’s definition is further expressed in the condensed code given in the calculation below.
How To Trade Using TFS Volume Oscillator
The TFS Volume Oscillator may be used in conjunction with other indicators. No trading signals are calculated.
How To Access in MotiveWave
Go to the top menu, choose Study>Volume Based>TFS Volume Oscillator
or go to the top menu, choose Add Study, start typing in this study name until you see it appear in the list, click on the study name, click OK.
Important Disclaimer: The information provided on this page is strictly for informational purposes and is not to be construed as advice or solicitation to buy or sell any security. Please see our Risk Disclosure and Performance Disclaimer Statement.
Calculation
//period = user defined, default is 7
//index = current bar number
iclose = 0;
iopen = 0;
vol = 0;
totV = 0;
    for (i = index - period + 1; i lessOr= index; i++)
        iclose = close[i];
        iopen = open[i];
        vol = getVolume(i)/1000000; //volume in millions
        if (iclose lessThan ioepn) totV = totV - vol;
        if (iclose moreThan ioepn) totV = totV + vol;
    endFor
Plot: tfsVo = totV / period;