Bollinger Bands® ATR
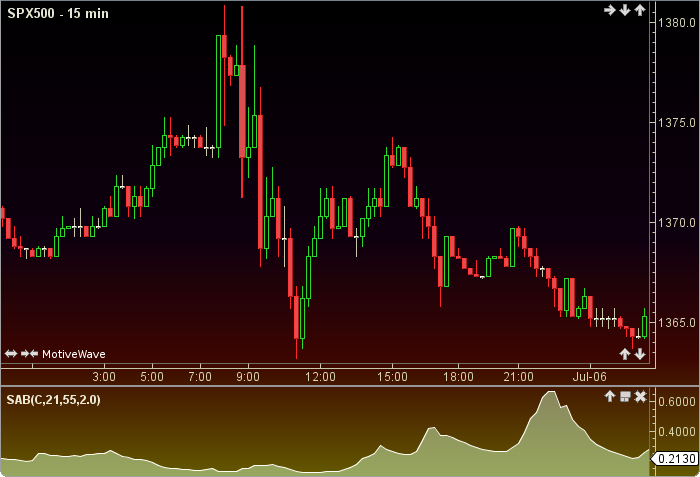
From his Standard Error Bands, the Bollinger Bands® ATR, was authored by Jon Anderson in Stocks and Commodities Mag. 09/1996. This indicator uses the quotient of the Average True Range, and Bollinger Bands® difference, to plot its path. The user may change the input (close), period lengths and Standard Deviation factor. This indicator’s definition is further expressed in the condensed code given in the calculation below.
How To Trade Using Bollinger Bands® ATR
Bollinger Bands® ATR may to be used in conjunction with other indicators. No trading signals are given.
How To Access in MotiveWave
Go to the top menu, choose Study>Bands>Bollinger Bands® ATR
Go to the top menu, choose Add Study, start typing in this study name until you see it appear in the list, click on the study name, click OK.
Important Disclaimer: The information provided on this page is strictly for informational purposes and is not to be construed as advice or solicitation to buy or sell any security. Please see our Risk Disclosure and Performance Disclaimer Statement.
Calculation
//input = price user defined, default is close
//atrPeriod = user defined, default is 22
//bPeriod = user defined, default is 55
//noStd = number of standard deviations = user defined, default is 2
//atr = average true range, bb = bollinger bands
//top= bb[0], bottom=bb[1]
//index = current bar number
atr = atr(index, artPeriod);
bb[] = bollingerBands(index, bPeriod, noStd, noStd, input);
bbDiff = bb[0] - bb[1];
Plot: artDev = atr / bbDiff;