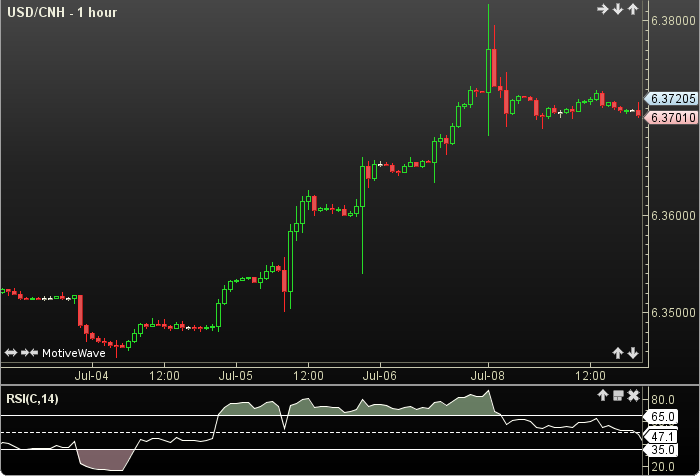
Relative Strength Index
The Relative Strength Index (RSI) was authored by Welles Wilder. RSI is a Momentum Oscillator that measures the velocity and magnitude of directional price movement by comparing upward and downward movements. Different versions of The RSI exist. The differences are mainly with the Moving Average method used. Wilder used an Smoothed Moving Average (SMMA) others use EMA or SMA (Cutlers version). The user may change the input (close), method (SMMA), period length and guide values. This indicator’s definition is further expressed in the condensed code given in the calculation below.
Click here for more information.
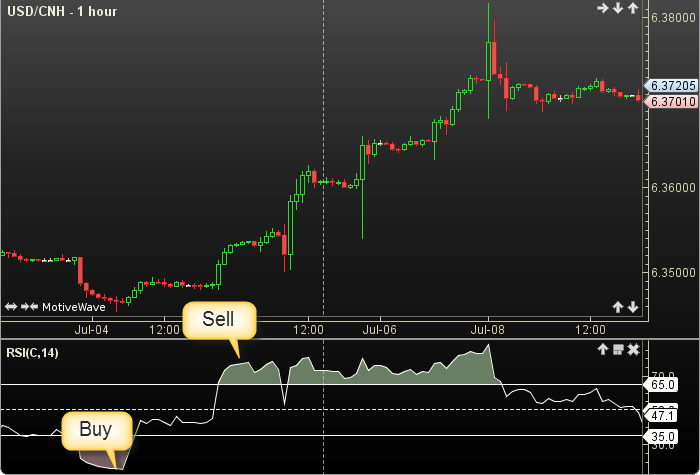
How To Trade Using the RSI
Adjust the top and bottom guides to control the quantity and quality of the trading signals. RSI values above 70 are considered to be overbought and therefore offer an opportunity to sell. RSI values below 30 are considered oversold and present an opportunity to buy. If the RSI crosses above the top guide a sell signal will be generated. Conversely, if the RSI crosses below the bottom guide a buy signal will be given. The 50 line divides the bulls above from the bears below.
How To Access in MotiveWave
Go to the top menu, choose Study>Welles Wilder>RSI
or go to the top menu, choose Add Study, start typing in this study name until you see it appear in the list, click on the study name, click OK.
Important Disclaimer: The information provided on this page is strictly for informational purposes and is not to be construed as advice or solicitation to buy or sell any security. Please see our Risk Disclosure and Performance Disclaimer Statement.
Calculation
//input = price, user defined, default is closing price
//method = moving average (ma), user defined, default is SMMA
//period = user defined, default is 14
//index = current bar number
    diff = price - price[index-1];
    up = 0, down = 0;
    if (diff MT 0) up = diff;
    else down = abs(diff);
    avgUp = ma(method, index, period, UP);
    avgDown = ma(method, index, period, DOWN);
    dSum = avUp + avDn;
    Plot RSI = (avUp / dSum) * 100;
    //signals
    buy = crossedAbove(RSI, topGuide);
    sell = crossedBelow(RSI, bottomGuide);