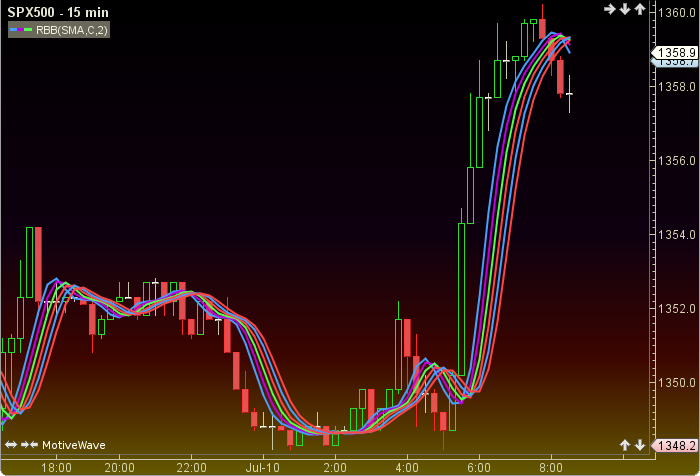
Rainbow B
Rainbow B was authored by Mel Widner in the Stocks and Commodities Magazine 07/1997. It is a colorful display of six smoothed moving averages. A moving average is considered a trend indicator. The user may change the input (close), method (SMA), period length and colors. This indicator’s definition is further expressed in the condensed code given in the calculation below.
How To Trade Using Rainbow B
Rainbow B may be used as a trend indicator in conjunction with other studies. No trading signals are given.
How To Access in MotiveWave
Go to the top menu, choose Study>Mel Widner>Rainbow B
or go to the top menu, choose Add Study, start typing in this study name until you see it appear in the list, click on the study name, click OK.
Important Disclaimer: The information provided on this page is strictly for informational purposes and is not to be construed as advice or solicitation to buy or sell any security. Please see our Risk Disclosure and Performance Disclaimer Statement.
Calculation
//input = price, user defined, default is close
//method = moving average = ma, user defined, default is SMA
//period = user defined, default is 2
avg1 = ma(method, period, input);
avg2 = ma(method, period, avg1);
avg3 = ma(method, period, avg2);
avg4 = ma(method, period, avg3);
Plot1: avg5 = ma(method, period, avg4);
Plot2: avg6 = ma(method, period, avg5);
Plot3: avg7 = ma(method, period, avg6);
Plot4: avg8 = ma(method, period, avg7);
Plot5: avg9 = ma(method, period, avg8);
Plot6: avg10 = ma(method, period, avg9);