Multi Level Indicator
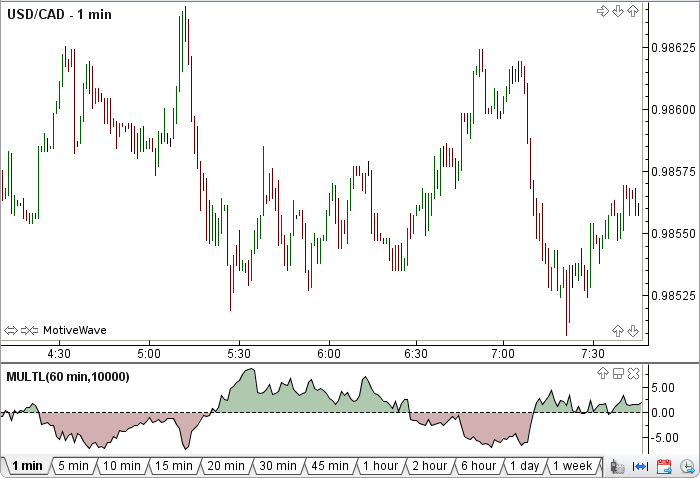
The Multi Level Indicator was authored by Vladimir Vladimirovich Voznjuk in the Stocks and Commodities Magazine Sept 2012. Use 1 minute price bars only. The close minus open of the 1 minute price bars are compared to a signal level close minus open time frame. The user may change the input (5 minute) and factor (10000). This indicator’s definition is further expressed in the condensed code given in the calculation below.
How To Trade Using the Multi Level Indicator
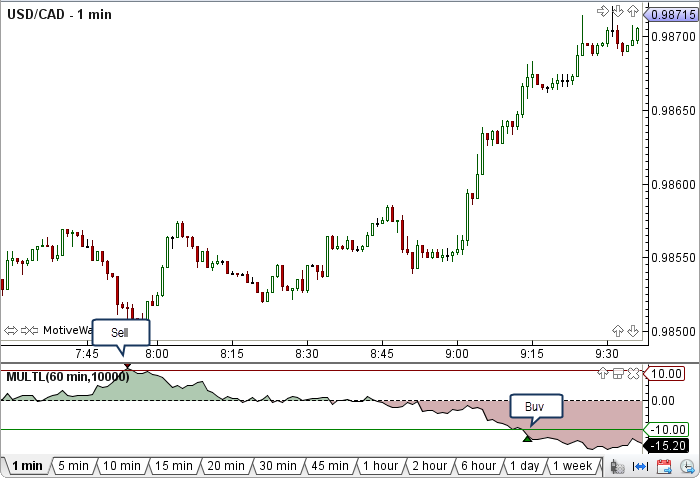
Adjust the top and bottom guides to control the quantity and quality of the trading signals. When the z value rises above the top guide a sell signal will be generated. When the z value falls below the bottom guide a buy signal will be given.
How To Access in MotiveWave
Go to the top menu, choose Add Study, start typing in this study name until you see it appear in the list, click on the study name, click OK.
Important Disclaimer: The information provided on this page is strictly for informational purposes and is not to be construed as advice or solicitation to buy or sell any security. Please see our Risk Disclosure and Performance Disclaimer Statement.
Calculation
//input = tFrame, user defined, default is 5 Minute
//factor = user defined, default is 10000
//i = current bar number, prev = previous
BarSize bar1 = series.getBarSize();
barMin1 = bar1.getInterval();
if (barMin1 != 1)
    return;
endif
xBarMin = convert(tFrame);
size = size();
if (size lessThan xBarMin ) return;

for (int i = xBarMin; i lessThan size; i++)
      close = series.getClose(i);
      open1 = series.getOpen(i);
      openx = series.getOpen(i - xBarMin);
      Plot: z = ((close - open1) - (close - openx)) * factor;
       //Signals
      boolean sell = prevZ lessThan topGuide AND z moreThan topGuide;
      boolean buy = prevZ moreThan bottomBuide AND z lessThan bottomGuide;
endFor