Linear Regression Slope
Linear Regression Slope is part of Standard Error Bands by Jon Anderson, Stocks and Commodities Mag. 09/1996. This study should be used with Standard Error PercentA, R Squared and Bollinger Bands®. The user may change the input (close) and period length. This indicator’s definition is further expressed in the condensed code given in the calculation below.
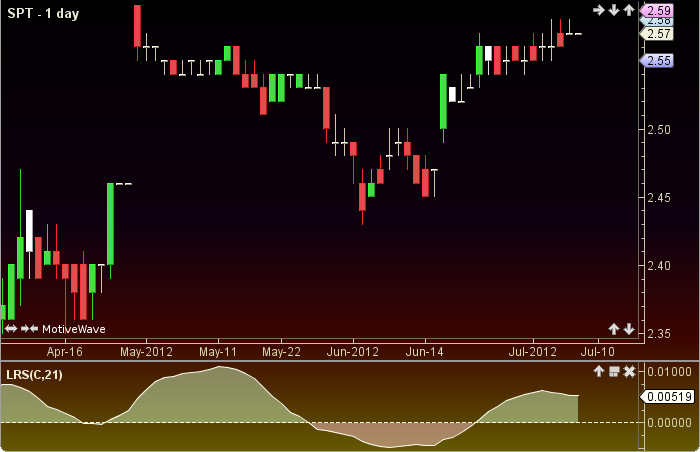
How To Trade Using Linear Regression Slope
Should be used with Standard Error PercentA, R squared and Bollinger Bands®. For a buy opportunity look for narrow Bollinger Bands® turning upward, R squared in the top 15 percent, and the upward trend of the Standard Error PercentA and the Linear Regression Slope. For a sell opportunity look for narrow Bollinger Bands® turning downward, R squared in the bottom 15 percent, and the downward trend of the Standard Error PercentA and Linear Regression Slope. No trading signals are calculated by this study.
How To Access in MotiveWave
Go to the top menu, choose Study>Oscillator>Linear Regression Slope
or go to the top menu, choose Add Study, start typing in this study name until you see it appear in the list, click on the study name, click OK.
Important Disclaimer: The information provided on this page is strictly for informational purposes and is not to be construed as advice or solicitation to buy or sell any security. Please see our Risk Disclosure and Performance Disclaimer Statement.
Calculation
//input = price, user defined, default is close
//period = user defined, default is 21
//index = current bar number
lrs = linRegLine(index, period, input, 0)[1];  //returns linear regression slope
Plot: lrs