Halloween Indicator
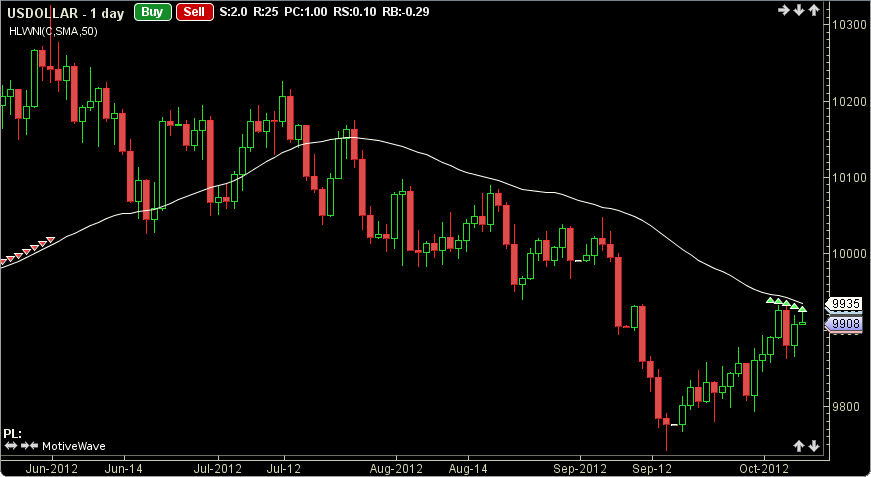
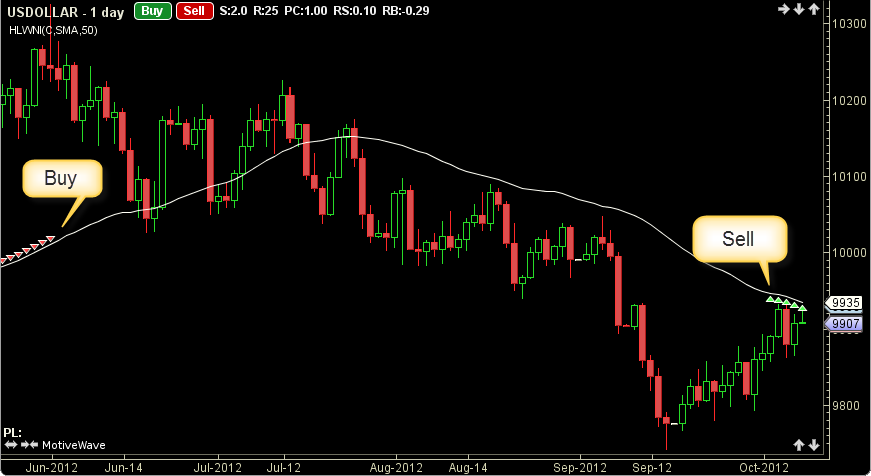
The Halloween Indicator was authored by Gerald Gardner in the Stocks And Commodities Magazine Oct,2012. It is a seasonal indicator with a simple strategy. If, in October the price of an instrument is below its 50 period Simple Moving Average, buy it, and in May, sell it. The user may change the input (close), method (SMA) and period length. This indicator’s definition is further expressed in the condensed code given in the calculation below.
How To Trade Using the Halloween Indicator
If the Halloween Indicator (HLWNI) is below the closing price and the month is October a buy signal is generated. If the month is May a sell signal is given.
How To Access in MotiveWave
Go to the top menu, choose Study>Custom>Halloween Indicator
or go to the top menu, choose Add Study, start typing in this study name until you see it appear in the list, click on the study name, click OK.
Important Disclaimer: The information provided on this page is strictly for informational purposes and is not to be construed as advice or solicitation to buy or sell any security. Please see our Risk Disclosure and Performance Disclaimer Statement.
Calculation
//input = price, user defined, default is closing price
//method = moving average, user defined, default is SMA
//period = user defined, default is 50
//index = current bar number
Plot: hlwni = ma(method, index, period, price);
// Check for signal events
GregorianCalendar cal = new GregorianCalendar();
curBarTime =  getStartTime(index);
cal.setTimeInMillis(curBarTime);
mth = cal.get(GregorianCalendar.MONTH);
sell = (mth == Calendar.MAY);
buy = (price lessThan hlwni AND mth == Calendar.OCTOBER);