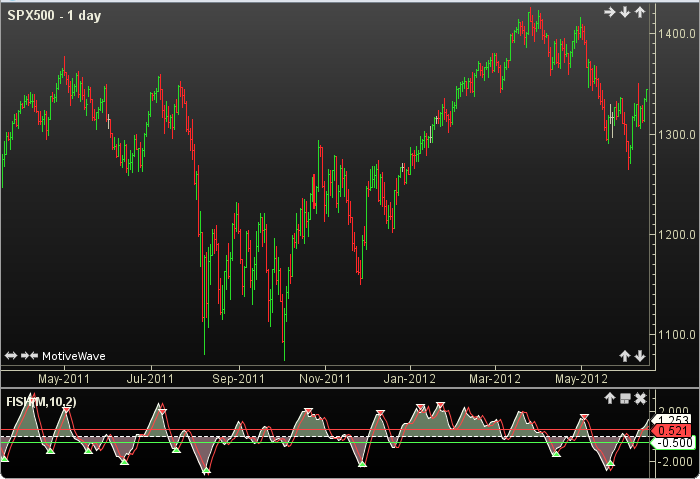
Fisher Transform
The Fisher Transform was presented by John Ehlers in the Stocks and Commodity Magazine November 2002. It assumes that price distributions behave like square waves. The Fisher Transform uses the mid-point or median price in a series of calculations to produce an oscillator. A signal line which is a previous value of itself is also displayed. Adjustable guides are also given to fine tune the signals. The user may change the input (midpoint), period lengths and guide values. This indicator’s definition is further expressed in the condensed code given in the calculation below.
How To Trade Using Fisher Transform
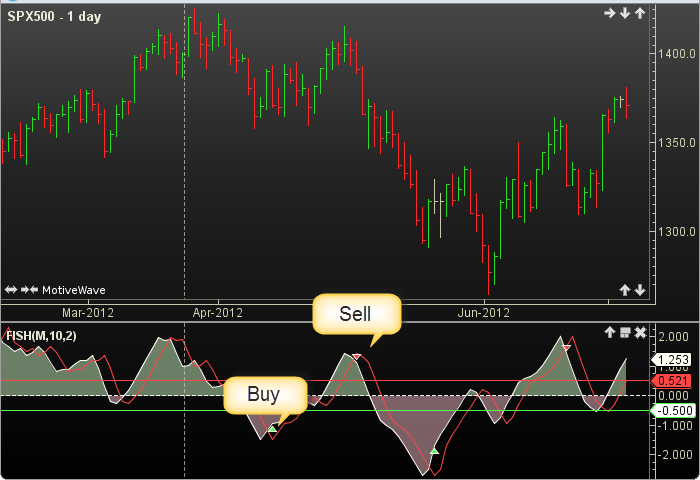
Adjust the top and bottom guides to control the quantity and quality of the trading signals. The Fisher Transform has a range of +1 to -1. In addition to the adjustable guides, if the fisher crosses the signal line a change in trend is predicted. If the Fisher is above the top guide and crosses below the signal line a sell signal will be generated. Conversely, if the Fisher is below the bottom guide and crosses above the signal line a buy signal will be given. The 0 line divides the bulls (above) from the bears (below).
How To Access in MotiveWave
Go to the top menu, choose Study>Oscillators>Fisher Transform
or go to the top menu, choose Add Study, start typing in this study name until you see it appear in the list, click on the study name, click OK.
Important Disclaimer: The information provided on this page is strictly for informational purposes and is not to be construed as advice or solicitation to buy or sell any security. Please see our Risk Disclosure and Performance Disclaimer Statement.
Calculation
//input = price user defined, default is midpoint or median
//period1 = user defined, default is 10
//period2 = user defined, default is 2
//prev = previous, index = current bar number
//LT = less than
//MT = more than
median = high + low / 2;
minMedian = lowest(index, period1, median);
maxMedian = highest(index, period1, median);
prevValue = VALUE[index-1];
prevFish = FISHER[index-1];
SIGNAL = FISHER[index-period2];
temp = (median - minMedian) / (maxMedian - minMedian);
VALUE = .5 * 2 * (temp - .5) + (.5 * prevValue);
if (VALUE mT .9999) VALUE = .9999;
temp = (1 + value) / (1 - value);
Plot1:FISHER = (.25 * log(temp)) + (.5 * prevFish);
Plot2: SIGNAL;
//Signals
highSell = fisher for last sell signal, reset to max_negative at each  buy signal;
lowBuy = fisher for last buy signal, reset to max_positive at each sell signal;
sell = fisher MT topGuide AND  crossedBelow(FISHER, SIGNAL) AND (fisher MT highSell);
buy =  fisher LT bottGuide AND crossedAbove(FISHER, SIGNAL) AND (fisher LT lowBuy);