Drunkard Walk
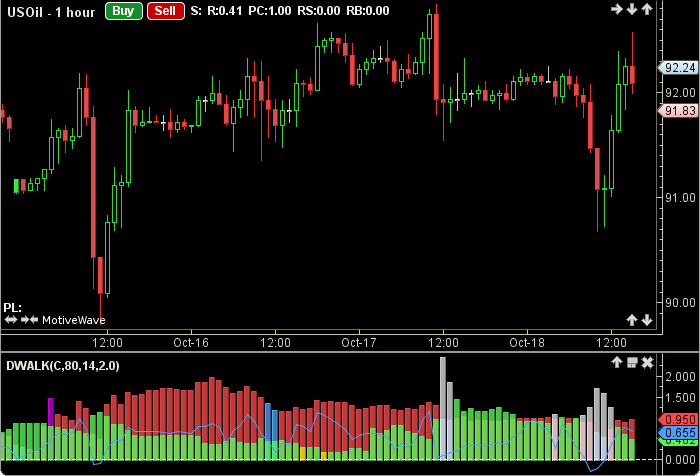
The Drunkard’s Walk was authored by Ron Davis in the Stocks And Commodities Mag, December 2011. It is also referred to as a random walk and is an attempt to generate a cycle-free trend identification. Two histograms are given one called an Up Walk, the other a Down Walk. Bollinger Band ranges of the Up and Down Walks determine the color scheme of the histograms. A PercentB path is also shown. The user may change the input (close), Standard Deviation factor and period lengths. This indicator’s definition is further expressed in the condensed code given in the calculation below
How To Trade Using Drunkard’s Walk
The Drunkard’s Walk may be used with other indicators such as Stochastic Oscillator, Bollinger Bands® and the Commodity Channel Index (CCI). No signals are given for this indicator.
How To Access in MotiveWave
Go to the top menu, choose Study>Custom>Drunkard’s Walk
or go to the top menu, choose Add Study, start typing in this study name until you see it appear in the list, click on the study name, click OK.
Important Disclaimer: The information provided on this page is strictly for informational purposes and is not to be construed as advice or solicitation to buy or sell any security. Please see our Risk Disclosure and Performance Disclaimer Statement.
Calculation
//input = price, user defined, default is closing price
//period = user defined, default is 80
//pbPeriod = user defined, default is 14
//std = Standard Deviation user defined, default is 2
//index = current bar number
lowArr[] = lowestBar(index, period, LOW);
highArr[] = highestBar(index, period, HIGH);
lowest = lowArr[0]; //lowest low for the period
highest = highArr[0];  //highest high for the period
maxBar = highArr[1]; //index for highest high
minBar = lowArr[1]; //index for lowest low
dnRun = index - maxBar;
upRun = index - minBar;
//Calculate Average True Range
atrUp = atr(index, upRun);
atrDn = atr(index, dnRun);
den = 0, upWalk = 0, dnWalk = 0;
if (dnRun moreThan 0 AND upRun moreThan 0)
  den = 1;
  if (atrUp moreThan 0)
    den = atrUp;
  endIf
  upWalk = (high-lowest) / (Math.sqrt(upRun) * den);
  den = 1;
  if (atrDn moreThan 0)
     den = atrDn;
  endIf
  dnWalk = (highest-low) / (Math.sqrt(dnRun) * den);
endIf
pcb = perCentB(pbPeriod, index, std, key);
Plot1 upWalk;
Plot2: dnWalk;
Plot3: pcb;
bbUp[] = bollingerBands(index, pbPeriod, std, std, UPWALK);
bbDn[] = bollingerBands(index, pbPeriod, std, std, DNWALK);

setBarColor(index, UPWALK, nUpC);
setBarColor(index, DNWALK, nDnC);

//bbUp[0], bbUp[1]  0 is for top band 1 is for bottom band
if (upWalk lessOrEqual bbUp[1])
     setBarColor(index, UPWALK, upBelowC);
endIf
if (dnWalk lessOrEqual bbDn[1])
      setBarColor(index, DNWALK, dnBelowC);
endIf
if (upWalk moreOrEqual bbUp[0])
      setBarColor(index, UPWALK, upAboveC);
endIf
if (dnWalk moreOrEqual bbUp[0])
      setBarColor(index, DNWALK, dnAboveC);
endIf