Directional Trend Index
The Directional Trend Index by William Blau may be used to determine if a stock is trending and also identifies overbought and undersold conditions. Adjustable guides are given to fine tune the signals. The user may change the method (EMA), period lengths and guide values. This indicator’s definition is further expressed in the condensed code given in the calculation below.
How To Trade Using Directional Trend Index
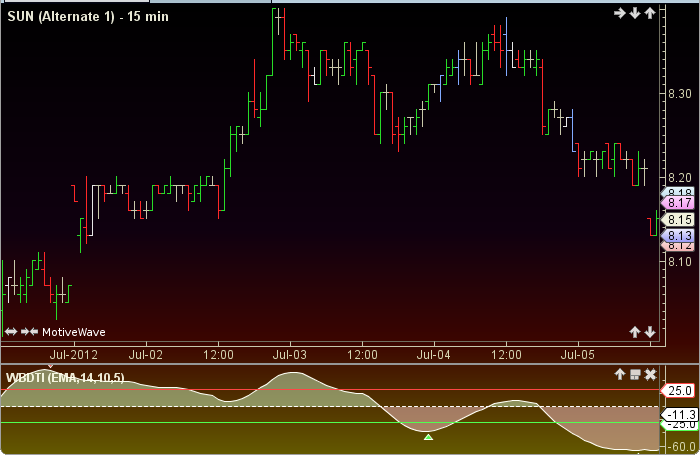
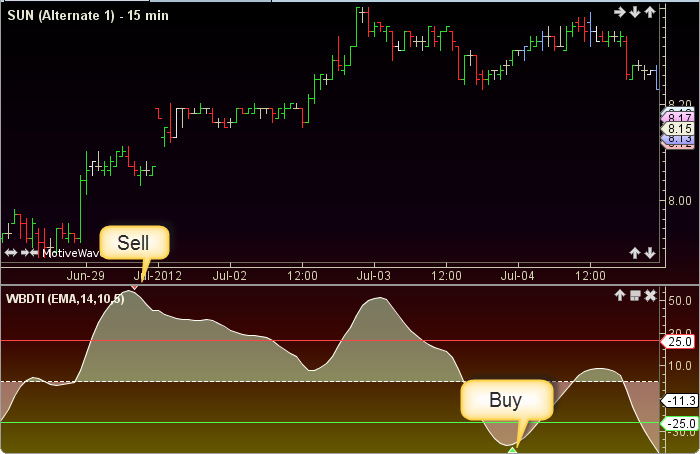
Adjust the top and bottom guides to control the quantity and quality of the trading signals. DTI values above 25 are considered to be overbought and therefore offer an opportunity to sell. DTI values below -25 are considered oversold and present an opportunity to buy. If the DTI peaks above the top guide a sell signal will be generated. Conversely, if the DTI troughs below the bottom guide a buy signal will be given. The 0 line divides the bulls (above) from the bears (below).
How To Access in MotiveWave
Go to the top menu, choose Study>William Blau>Directional Trend Index
or go to the top menu, choose Add Study, start typing in this study name until you see it appear in the list, click on the study name, click OK.
Important Disclaimer: The information provided on this page is strictly for informational purposes and is not to be construed as advice or solicitation to buy or sell any security. Please see our Risk Disclosure and Performance Disclaimer Statement.
Calculation
//method = moving average (ma) user defined, default is EMA
//rPeriod = user defined, default is 14
//sPeriod = user defined, default is 10
//uPeriod = user defined, default is 5
//prev = previous
//LT = less than, MT = more than
//abs = absolute value, index = current bar number
prevHigh = high[index-1];
prevLow = low[index-1];
hmu = 0;
if (high - prevHigh MT 0) hmu = high - prevHigh;
lmd = 0;
if (low - prevLow LT 0) lmd = -(low - prevLow);
diff = hmu - lmd;
absDiff = abs(diff);
ma1 = ma(method, index, rPeriod, diff);
aMa1 = ma(method, index, rPeriod, absDiff);
ma2 = ma(method, index, sPeriod, ma1);
aMa2 = ma(method, index, sPeriod, aMa1);
ma3 = ma(method, index, uPeriod, ma2);
aMa3 = ma(method, , index, uPeriod, aMa2);
Plot: dti = 100 * ma3 /aMa3;
//Signals
prevDti = dti[index-1];
highSell = dti for last sell signal, reset to max_negative at each  buy signal;
lowBuy = dti for last buy signal, reset to max_positive at each sell signal;
sell = (dti MT topGuide) AND (prevDti MT dti) AND (dti MT highSell); //peaked above topGuide
buy = (dti LT bottomGuide AND prevDti LT dti) AND (dti LT lowBuy);  //trough below bottomGuide