Darvas Box
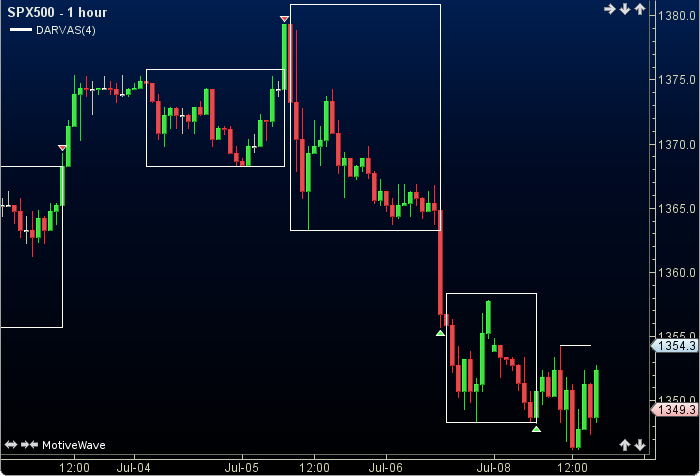
The Darvas Box (DB) was authored by Nicholas Darvas. The DB system uses highs, lows and a series of logical states to draw boxes around specific groups of price bars. Signals are given when the price breaks through the box.
State 1 can start with any bar, and establishes the high.
State 2 is when the period high is lower than the State 1 period, otherwise it remains in State 1 and forms a new box top.
State 3 when the period high is lower than the State 2 period, otherwise it returns to State 1 and forms a new box top. In State 3 a box bottom is formed. This may or may not be the same bar that formed the box top.
State 4 is when the period low is higher than the State 3 period, otherwise it remains in State 3 and forms a new box bottom. (If the period high is higher than the box top, form a new box top and return to State 1.)
State 5 when the period low is higher than the State 4 period, otherwise it returns to State 3 and forms a new box bottom. (If the period high is higher than the box top, form a new box top and return to State 1.)
Only after State 5 is reached is a complete box formed on the chart.
How To Trade Using Darvas Box
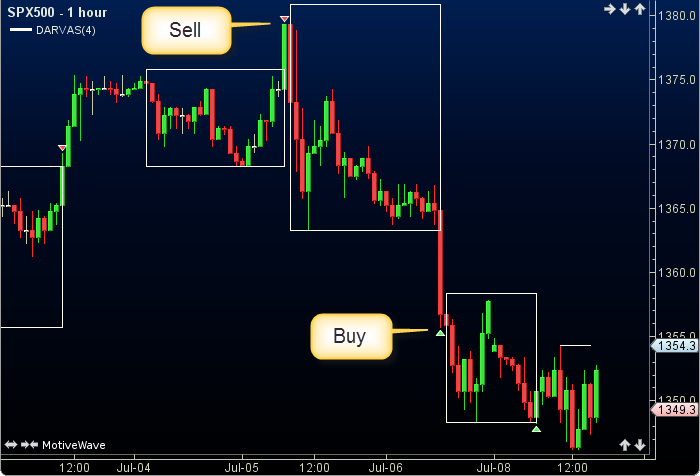
Experiment with different time scales, some say weekly charts are best. Once a box is completed, if a high moves above the box top a sell signal will be generated. Conversely, if a low goes below the box bottom a buy signal will be given.
How To Access in MotiveWave
Go to the top menu, choose Study>Overlays>Darvas Box
or go to the top menu, choose Add Study, start typing in this study name until you see it appear in the list, click on the study name, click OK.
Important Disclaimer: The information provided on this page is strictly for informational purposes and is not to be construed as advice or solicitation to buy or sell any security. Please see our Risk Disclosure and Performance Disclaimer Statement.
Calculation
//period = user defined, default is 4
//LOE = less or equal, MOE = more or equal
state = 0;
hPrice = 0;
lPrice = 0;
boxTop = 0;
boxBott = 0;
startX = 0;
countTop = 0;
countBott = 0;
endIndex = getEndIndex()-1;
for (i = 0; (i LOE endIndex); i++)
    hPrice = getHigh(i);
    lPrice = getLow(i);
    countTop++;
    if (countTop MOE period) state = 2;
    if (countTop MOE (period*2)) state = 3; countBott++;
    if (countTop MOE (period*2) AND countBott MOE period) state = 4;
    if (countTop MOE (period*2) AND countBott MOE (period*2)) state = 5;
    if (hPrice moreThan boxTop)
        if (state == 5)
            plotBox(startX, boxTop, i, boxBott);
            signal(true);  //Sell signal
            state = 1;
            boxTop = 0;
            countTop = 0;
            countBott = 0;
            continue;
        endIf
        boxTop = hPrice;
        boxBott = lPrice;
        startX = i;
        state = 1;
        countTop = 0;
        countBott = 0;
        continue;
    endIf
    if (lPrice lessThan boxBott)
        if (state == 5)
            plotBox(startX, boxTop, i, boxBott);
            signal(false); //Buy signal
            state = 1;
            boxTop = 0;
            countTop = 0;
            countBott = 0;
            continue;
        endIf
        boxBott = lPrice;
        countBott = 0;
    endIf
    if (state == 2) plotTop(startX, i, boxTop);
    if (state == 3) plotTop(startX, i, boxTop);
    if (state == 3) plotBott(startX, i, boxBott);
    if (state == 4) plotBott(startX, i, boxBott);
endFor
....
Method plotBox(startX,  boxTop, endX, boxBott)
    if (getSettings().getPath(Inputs.PATH).isEnabled())
        if (topLine != null) removeFigure(topLine);
        if (bottLine != null) removeFigure(bottLine);
        PathInfo lineInfo = getSettings().getPath(Inputs.PATH);
        Coordinate start = new Coordinate(getStartTime(startX), boxTop);
        Coordinate end = new Coordinate(getStartTime(endX), boxTop);
        Line line = new Line(start, end, lineInfo);
        addFigure(line);
        start = new Coordinate(getStartTime(endX), boxTop);
        end = new Coordinate(getStartTime(endX), boxBott);
        line = new Line(start, end, lineInfo);
        addFigure(line);
        start = new Coordinate(getStartTime(endX), boxBott);
        end = new Coordinate(getStartTime(startX), boxBott);
        line = new Line(start, end, lineInfo);
        addFigure(line);
        start = new Coordinate(getStartTime(startX), boxBott);
        end = new Coordinate(getStartTime(startX), boxTop);
        line = new Line(start, end, lineInfo);
        addFigure(line);
    endIf
endMethod
....
Method plotTop(startX, endX, boxTop)
if (getSettings().getPath(Inputs.PATH).isEnabled())
        PathInfo lineInfo = getSettings().getPath(Inputs.PATH);
        Coordinate start = new Coordinate(getStartTime(startX), boxTop);
        Coordinate end = new Coordinate(getStartTime(endX), boxTop);
        if (topLine != null) removeFigure(topLine);
        Line line = new Line(start, end, lineInfo);
        topLine = line;
        addFigure(line);
    endIf
endMethod
....
Method plotBott(startX, endX, boxBott)
    if (getSettings().getPath(Inputs.PATH).isEnabled()){
        PathInfo lineInfo = getSettings().getPath(Inputs.PATH);
        Coordinate start = new Coordinate(getStartTime(startX), boxBott);
        Coordinate end = new Coordinate(getStartTime(endX), boxBott);
        if (bottLine != null) removeFigure(bottLine);
        Line line = new Line(start, end, lineInfo);
        bottLine = line;
        addFigure(line);
    endIf
endMethod
....