Chartmill Value Indicator
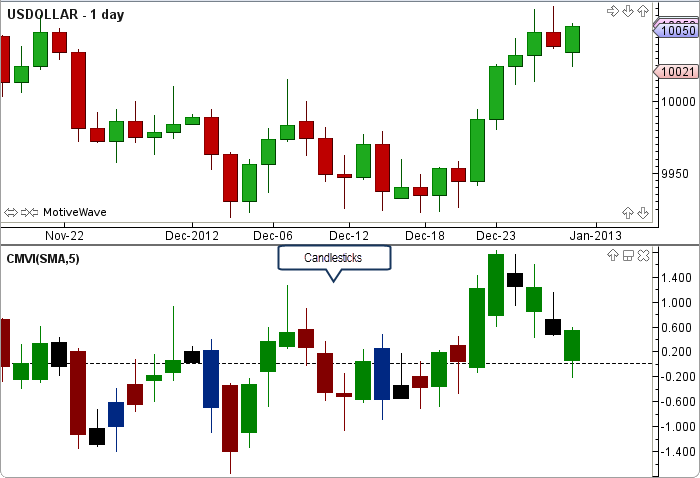
The Chartmill Value Indicator (CMVI) was authored by Dirk Vandycke in the Stocks and Commodities Magazine, January 2013. The CMVI uses Moving Averages of True Range and the Midpoint price to calculate adjusted open, high, low and closing prices. These adjusted values are displayed as price bars on a seperate graph. The user may change the method (SMA), period length and price bar type. This indicator’s definition is further expressed in the condensed code given in the calculation below.
How To Trade Using The Chartmill Value Indicator
No trading signals are calculated for this indicator.
How To Access in MotiveWave
Go to the top menu, choose Add Study, start typing in this study name until you see it appear in the list, click on the study name, click OK.
Important Disclaimer: The information provided on this page is strictly for informational purposes and is not to be construed as advice or solicitation to buy or sell any security. Please see our Risk Disclosure and Performance Disclaimer Statement.
Calculation
//method = moving average, user defined, default is SMA
//x = period, user defined, default is 5
//type = price bar type, default is Candlesticks
//index = current bar number
f = ma(method, index, x, MIDPOINT);//MIDPOINT=(high+low)/2
v = ma(method, index, x, TR);//TR=True Range
cmvC = (close - f) / v;
cmvH = (high - f) / v;
cmvL = (low - f) / v;
cmvO = (open - f) / v;
prevCmvO = cmvO[index-1];
prevCmvH = cmvH[index-1];
prevCmvL = cmvL[index-1];
prevCmvC = cmvC[index-1];
Figure fig = new PriceBar(ctx, index, type, cmvO, cmvH, cmvL, cmvC, prevCmvO, prevCmvH, prevCmvL, prevCmvC);
addFigure(fig);