Buff Averages
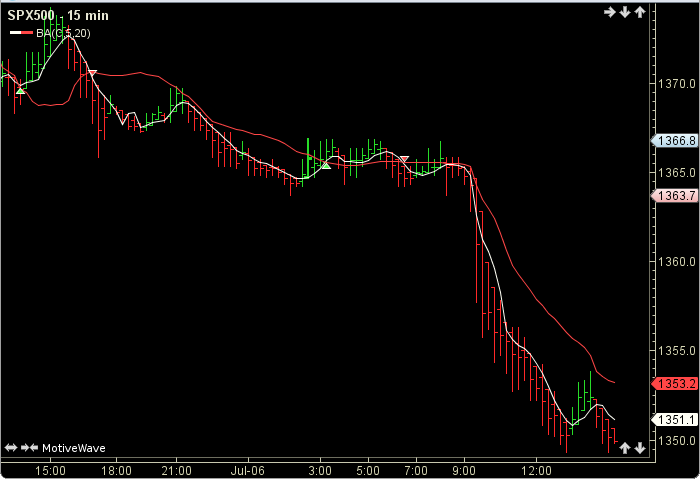
Buff Averages by Buff Dormeier displays two moving averages based on price and volume. When the two averages cross trading signals are given. The user may change the input (close) and period lengths. This indicator’s definition is further expressed in the condensed code given in the calculation below.
How To Trade Using Buff Averages
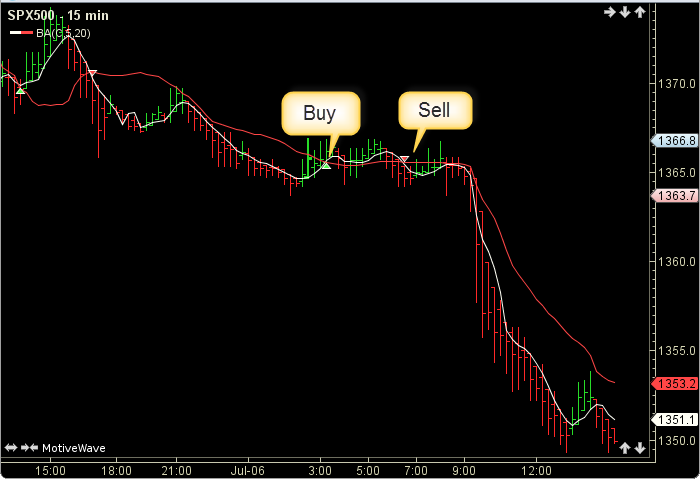
Trading signals are generated when the fastBuff and the slowBuff cross. If the fastBuff crosses above (upward movement) a buy signal is generated. Conversely, if the fastBuff crosses below (downward movement) a sell signal is given.
How To Access in MotiveWave
Go to the top menu, choose Study>Moving Averages>Buff Averages
or go to the top menu, choose Add Study, start typing in this study name until you see it appear in the list, click on the study name, click OK.
Important Disclaimer: The information provided on this page is strictly for informational purposes and is not to be construed as advice or solicitation to buy or sell any security. Please see our Risk Disclosure and Performance Disclaimer Statement.
Calculation
//input = price (user defined, default is close)
//fastPeriod = user defined, default = 5
//slowPeriod = user defined, default = 20
//num = numerator
//den = denomator, index = current bar number
priceVol = input * volume;
num = sum(index, fastPeriod, priceVol);
den = sum(index, fastPeriod, volume);
Plot1: fastBuff = num / den;
num = sum(index, slowPeriod, priceVol);
den = sum(index, slowPeriod, volume);
Plot2: slowBuff = num / den;
//Signals
buy = crossedAbove(fastBuff, slowBuff);
sell = crossedBelow(fastBuff, slowBuff);