Adaptive Smoothing Indicator
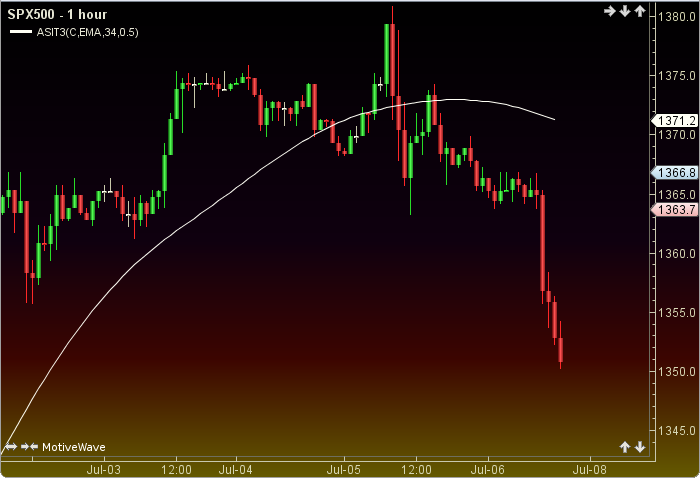
The Adaptive Smoothing Indicator, or Tilson T3, combinds a series of moving averages with a user defined volume factor. The user may change the input (close), method (EMA), period length and factor. This indicator’s definition is further expressed in the condensed code given in the calculation below.
How To Trade Using Adaptive Smoothing Indicator
The Adaptive Smoothing Indicator or Tilson T3 may be used in conjunction with other indicators as a trend indicator. No trading signals are given.
How To Access in MotiveWave
Go to the top menu, choose Study>Overlays>Adaptive Smoothing Indicator T3
or go to the top menu, choose Add Study, start typing in this study name until you see it appear in the list, click on the study name, click OK.
Important Disclaimer: The information provided on this page is strictly for informational purposes and is not to be construed as advice or solicitation to buy or sell any security. Please see our Risk Disclosure and Performance Disclaimer Statement.
Calculation
//input = price, user defined, default is closing price
//period = user input, default 40
//volFac = volume factor, user defined, default .5
//ema = expotintial moving average
//index = current bar number
ema1=ma(method, index, period, input);
ema2=ma(method, index, period, ema1);
gd1=(ema1 * (1 + volFac)) - (ema2 * volFac);
ema3=ma(method, index, period, gd1);
ema4=ma(method, index, period, ema3);
gd2=(ema3 * (1 + volFac)) - (ema4 * volFac);
ema5=ma(method, index, period, gd2);
ema6=ma(method, index, period, ema5);
Plot: T3=(ema5 * (1 + volFac)) - (ema6 * volFac);