RSI With RSI Strategy
The RSI With RSI Strategy was authored by Peter Konner in the Stocks and Commodities Magazine January 2011. Two plots of Welles J. Wilders Relative Strength Index (RSI) and 2 Moving Averages are used to trigger trading signals. The slow and quick plots are designed to allows trades on long term up trends and short term corrections. The Strategy is designed for weekly trading and Long position only. The user may change the input (close) methods and period lengths. This indicator’s definition is further expressed in the condensed code given in the calculation below.
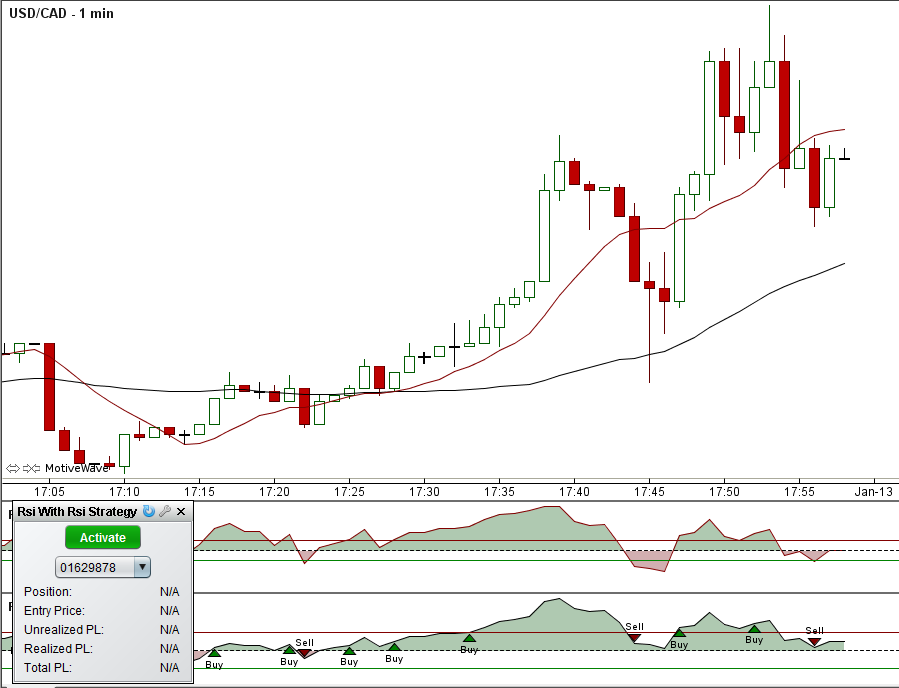
How To Trade Using The RSI With RSI Strategy
Review Peter Konner’s article and use back testing to help determine the optimum input values.
How To Access in MotiveWave
Go to the top menu, choose Strategy>Add Strategy, start typing in this strategy name until you see it appear in the list, click on the strategy name, click OK.
Important Disclaimer: The information provided on this page is strictly for informational purposes and is not to be construed as advice or solicitation to buy or sell any security. Please see our Risk Disclosure and Performance Disclaimer Statement.
Calculation
//input = price, default is closing price
//rsiMethod = moving average,default is SMMA
//rsiSlowPeriod = rsi slow period default is 17
//rsiQuickPeriod = default is 5
//maMethod = moving average,default is SMA
//maSlowPeriod = rsi slow period default is 40
//maQuickPeriod = default is 10
//index = current bar number
Code may be available on request.